Running the JavaScript™ debugger
The JavaScript™ debugger runs automatically when JavaScript™ code is encountered. You control the debugger from the Domino® Designer debug interface.
Before you begin
Procedure
- Insert
debuggerstatements in the JavaScript™ code as desired.In debug mode, this statement stops execution the same as a breakpoint. In non-debug mode, this statement has no effect.Note: Usedebuggerstatements only in code that runs on a server with IBM® Domino® 9.0 Social Edition or greater. Thedebuggerstatement does not work on earlier versions of Domino® and may cause problems. - Open or preview the XPage containing the JavaScript™ code and activate the design
element that causes the code to run.If
Stop at
first line of server-side JavaScript
is in effect, the code stops at the beginning of the first JavaScript™ section. Otherwise the code stops at the first breakpoint. If nothing is set, the code executes without stopping. - Go to the Eclipse debug interface.The following views reflect the state of the run-time where it is stopped:
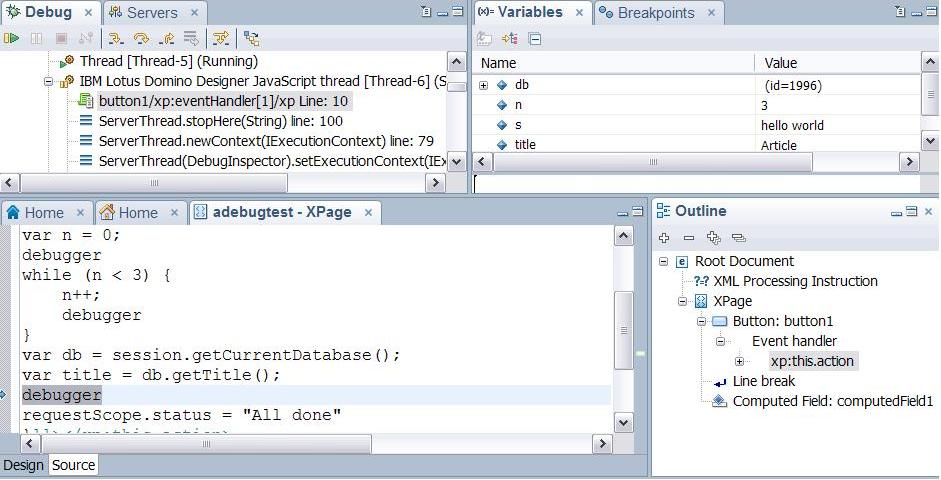
- The debug view shows the current stack frame, including the Java™ stack.
- The editor view shows the code being executed. An arrow on the left points to the current line. You can edit the code, but you must reactivate the target design element to have the code take effect.
- The variable view shows the names and current values of variables in the current code.
- Continue execution using the debug controls.Click the
Resumetoolbar button to resume execution and stop at the next breakpoint. ClickStep Into,Step Over, and other toolbar buttons for alternate actions. - Set and manage breakpoints in the XPages Source editor
as follows:
Example
click event
for a button:var s = "hello world";
var n = 0;
debugger
while (n < 3) {
n++;
debugger
}
var db = session.getCurrentDatabase();
var title = db.getTitle();
debugger
requestScope.status = "All done"- You open the containing XPage on the run-time server and click
the button that starts the JavaScript™ code.
The debugger stops at the first
debuggerstatement. The variableshas the valuehello world. The variablenhas the value0. - You click the Resume toolbar button. The
debugger stops at the second
debuggerstatement. The variablenhas the value1. - You click the Resume toolbar button. The
debugger again stops at the second
debuggerstatement. The variablenhas the value2. - You click the Resume toolbar button. The
debugger again stops at the second
debuggerstatement. The variablenhas the value3. - You click the Resume toolbar button. The
debugger stops at the third
debuggerstatement. The variablesdbandtitleare defined. The variabledbis an object that can be expanded. - You click the Resume toolbar button. The code completes and the debugger exits.
debugger statement: