Visualization Parameters: General
The General tab of the Visualization Parameters dialog helps you to customize a graphical representation of your network.
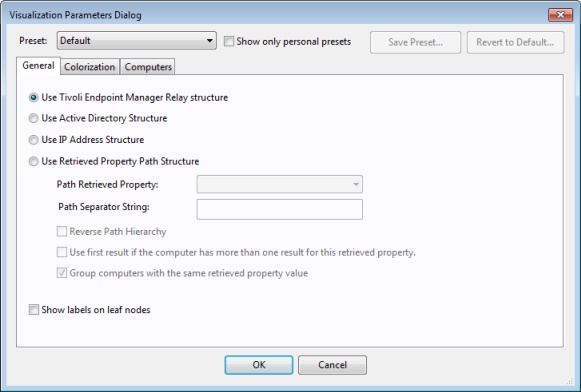
There are several ways to represent the data:
- Use Relay structure: Display the network tree from the BigFix Relay point of view. This is the default view.
- Use Active Directory Structure: Use the Active Directory to map out the network tree for visualization.
- Use IP Address Structure: Use the IP architecture to map out the network tree.
- Use Retrieved Property Path Structure: Use standard or custom properties of the
client computers to map out a custom network tree. If you select this option, you must specify the
path-style property that you want from the section below:
- Path Retrieved Property: This pull-down menu lists the available BigFix Client properties. Select one of these to define the network graph. A path-style property has a separator string to delimit the parts of the path. For example, if you use an IP address as a path, you would select a period as a separator. Another example is an actual directory path, where the delimiter is a backslash. You can also create your own custom paths by concatenating fields with your own chosen separator.
- Path Separator String: Enter the delimiter you want to use to parse the path specified above. For example, to create a hierarchy from a directory path, use '\' as a separator string.
- Reverse Path Hierarchy: Check this box if your chosen path-style property has the most significant part on the right instead of the left.
- Use first result if the computer has more than one result for this retrieved property: Many properties return a list, rather than a single item. These values can be ignored, or you can check this box to have the first element in the list used for the network map.
- Group computers with the same retrieved property value: This option creates easy-to-visualize groups from computers sharing the same property.
- Show labels on leaf nodes: Check this box if you want to display labels next to the computers at the leaf nodes of the network tree.
This dialog is available by selecting Tools > Launch Visualization Tool...