ELK (Kibana) Dashboard Connector
ELK (Elastic, Logstash, Kibana) connector allows creation of conversational and usage analytics of a particular tenant using Kibana’s out of the box dashboarding capabilities. The dashboards are populated by fetching data from the current tenant’s datapoint. To enable visualization of BigFix AEX data in a Kibana dashboard follow the steps provided in the connector configuration page which is dynamically generated for every tenant.
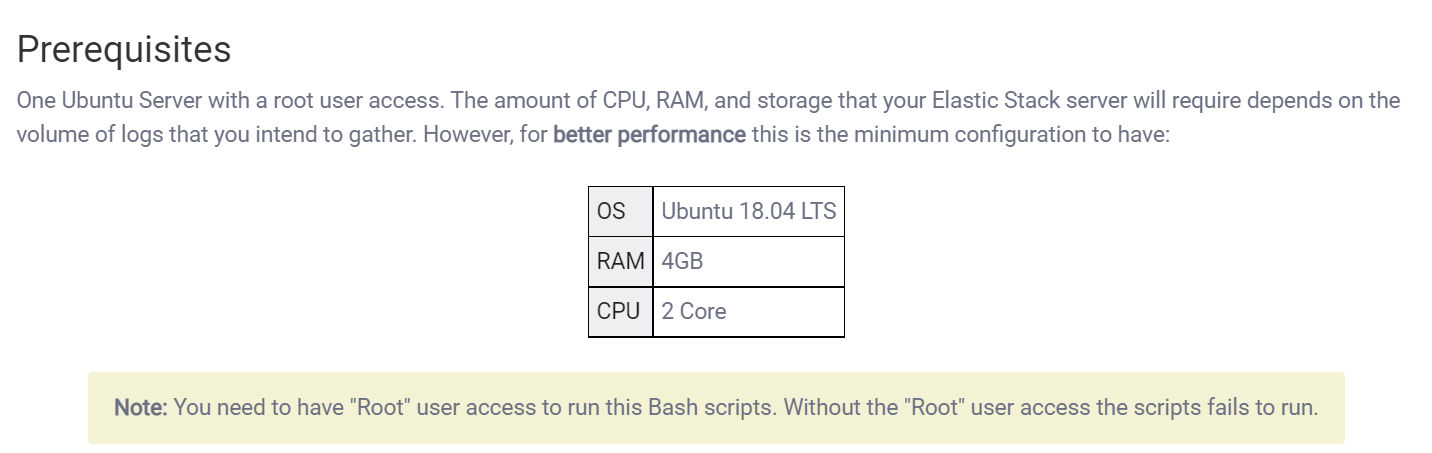
- ELK dashboard requires availability of a dedicated virtual machine to host ELK server, ensure you have the appropriate infrastructure for deploying ELK.
- Log into Global admin and navigate to Tenants page under Provider tab.
.png)
- Click on the Configure button
.png) available in
Actions column.
available in
Actions column. - In tenant’s configuration page, click on Open in “Choose Integrations” card.
.png)
- Click on Open on “ELK” connector.
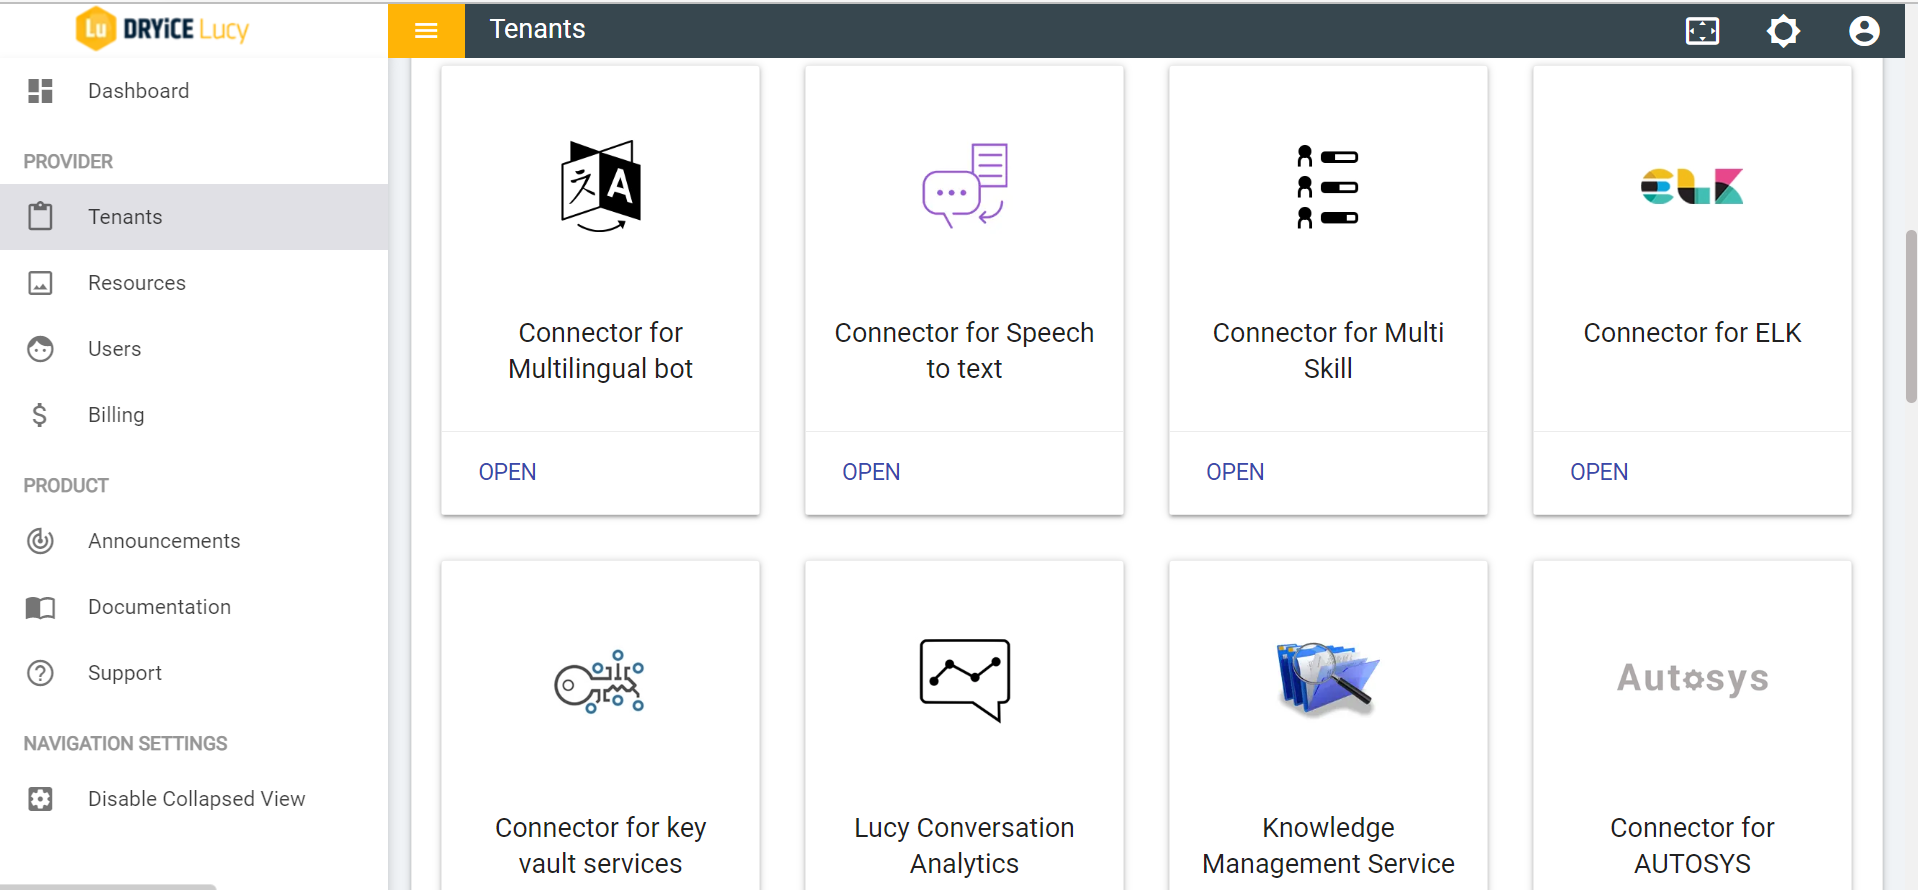
- On opening the connector page, instance specific details would be available to deploy an ELK server for displaying analytics and dashboard on Kibana. Follow these steps to setup the deploy and access the dashboard.