
Marketplace Analytics
Marketplace Operators can view sales, orders, top products, and other details through the Management Center. Marketplace Sellers and Seller Administrators can only view the data related to the Sellers assigned to them.
You can view the Marketplace Analytics dashboard through the Seller Dashboard.
Analytics Dashboard
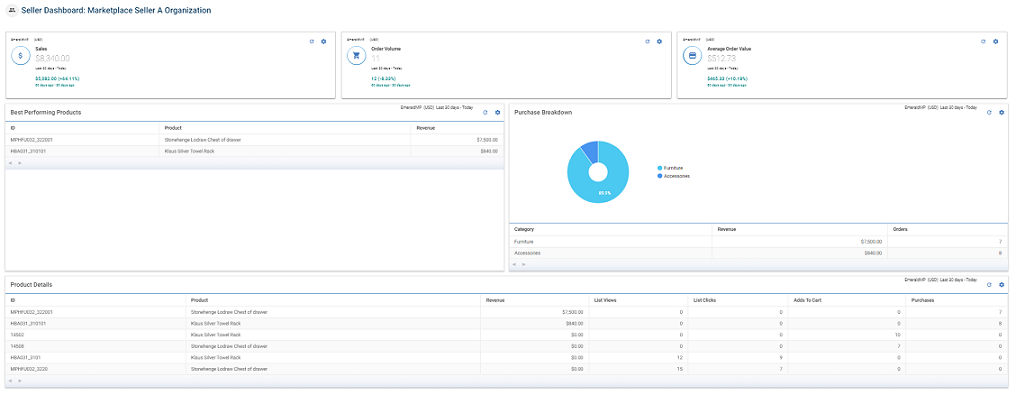
The Seller Dashboard landing page allows you to view the following information:
- Sales: The actual order value is calculated to display the total sales.
- Order Volume: The number of orders placed through the marketplace store.
- Average Order Value: The average value is calculated by dividing total sales and the order value.
- Best performing products: The highest purchased products are displayed for the selected date range. The products are listed in descending order as per the revenue.
- Purchase Breakdown: The total purchase breakdown is divided into categories. The total revenue and orders for each category are displayed in a tabular form.
- Product Details: This column displays the following
information:
Heading Description Product Name of the product. Revenue Total revenue generated by the product. List Views The number of times the product was viewed. List Clicks The number of times the product was clicked to view further product information. Adds to Cart The number of times the product was added to the cart. Purchases The number of times the product was purchased from the marketplace store.
You can configure the information that is displayed on the dashboard. A setting icon
is given for each column to configure the settings. You can configure the following information:
- Marketplace: All the marketplaces assigned to the seller are listed. Select the Marketplace to view the data.
- Currency: All the currencies assigned to the selected marketplace are listed. Select the currency.
- Date Range: You can view the data for the last day, last seven days, and
thirty days.Note: Last thirty days' data for the selected marketplace is displayed by default. The comparison data for the last 60 days to 30 days is displayed by default.
- Select the check-box given for the Select custom date
range to view the data for specific days.
- Select the Start Date and End Date.
- Select the Comparison Start Date and
Comparison End Date to compare the data
within the selected date range.Note: The comparison date range option is disabled for best-performing products, purchase breakdown, and product details columns.
- To apply the configuration for all the columns, select the check-box in front of Apply configuration globally.
- Click Confirm to confirm the configuration. The analytics dashboard displays the data as per the set configuration.
- Click on the
 Refresh icon to refresh the column and view the
latest data.
Refresh icon to refresh the column and view the
latest data.