Analyzing Out of Memory issues using the Memory Analyzer Tool
Once you have identified the type of Out Of Memory (OOM) error that you are encountering, you can look at the heapdump or core using the Memory Analyzer Tool (MAT). For more information on MAT, see Memory Analyzer Tool (MAT) in the HCLSoftware community, to understand the installation and how to use MAT and the concepts around Objects, Shallow, and Retained. Reviewing a heapdump or core is a complex task and challenging to document. There are many ways to approach reviewing heapdumps and cores. The most straightforward approach is to use MAT to find the objects consuming most of the memory. Use the leak suspects to identify the top customers. However, use the histogram to sort by retained heap. This will enable you to look for the references for the object by examining downwards through the object tree.
One of the advantages of using native cores for memory analysis is that with the Memory Analyzer tool, you can list threads and the memory they are using to find details for the request associated with each WebContainer thread.
- Sample 1
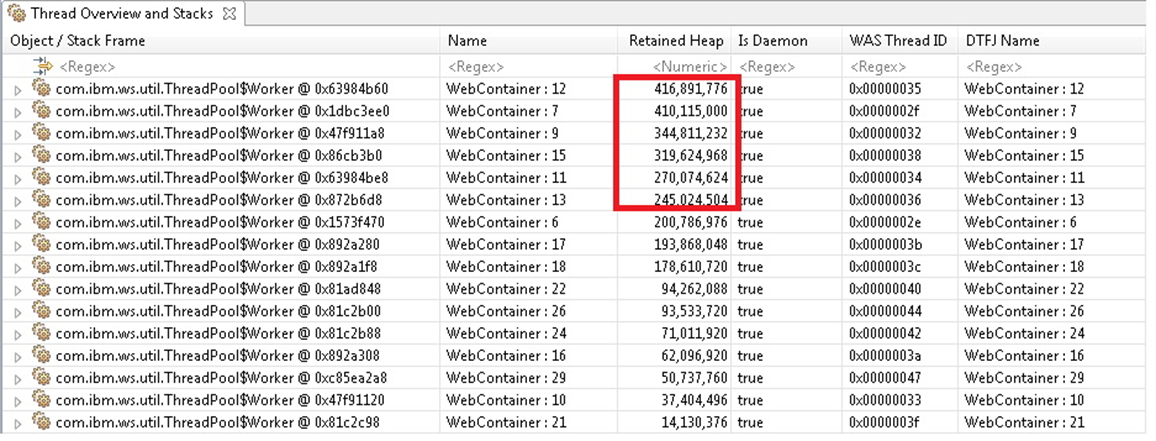
- After opening the native core in MAT, go to to list the threads. In the sample screen shot below, you can see
several threads using a very large amount of memory. The first one, for example,
WebContainer 12 is using 416 MB. This needs to be
investigated.
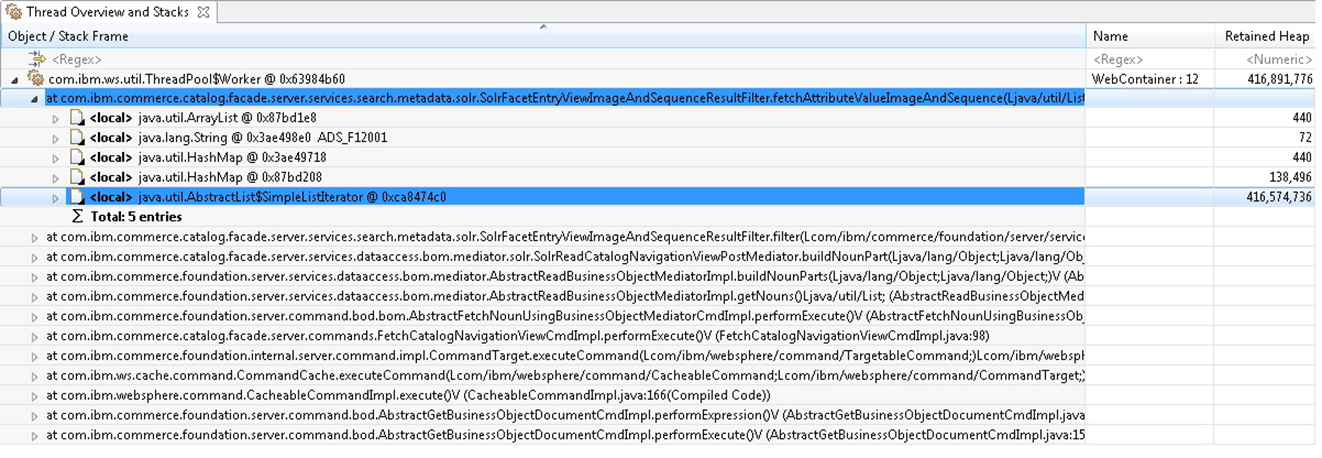
Expanding the thread names will show the stack. You can also see the objects that were allocated under each frame:
If you identify a thread consuming an abnormal amount of memory, it can be useful to understand what request the thread was processing. Use the following steps to find information for the request such as the URI, query string, cookies, etc.
For a WebContainer thread, look at the bottom of the stack to find the execution of
com.ibm.ws.webcontainer.WebApp.handleRequest(). Expand _dispatchContext and parentContext. Inside those objects you will find information for the request such as the URI and query strings: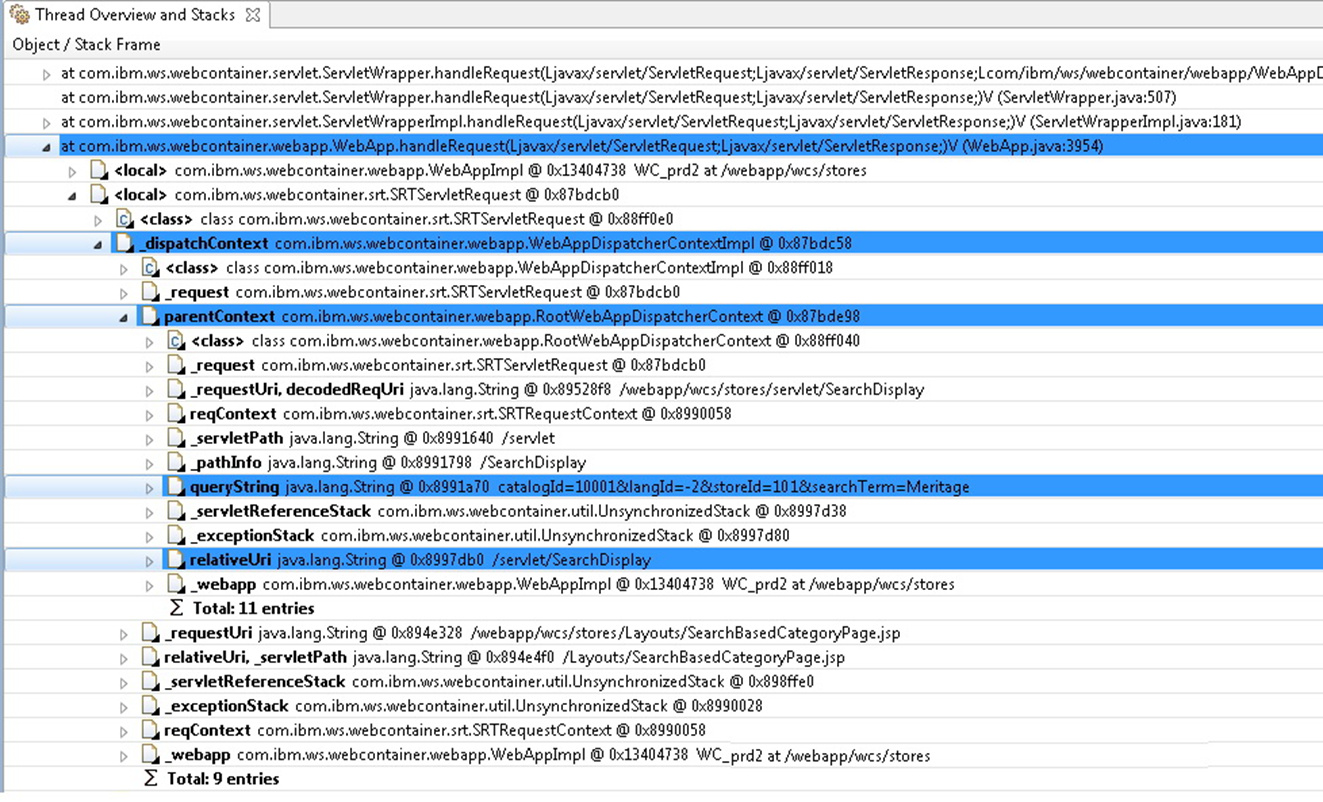
Then, inside
com.ibm.ws.webcontainer.WebApp.handleRequest(), find the SRTServletRequest object, and expand _srtRequestHelper: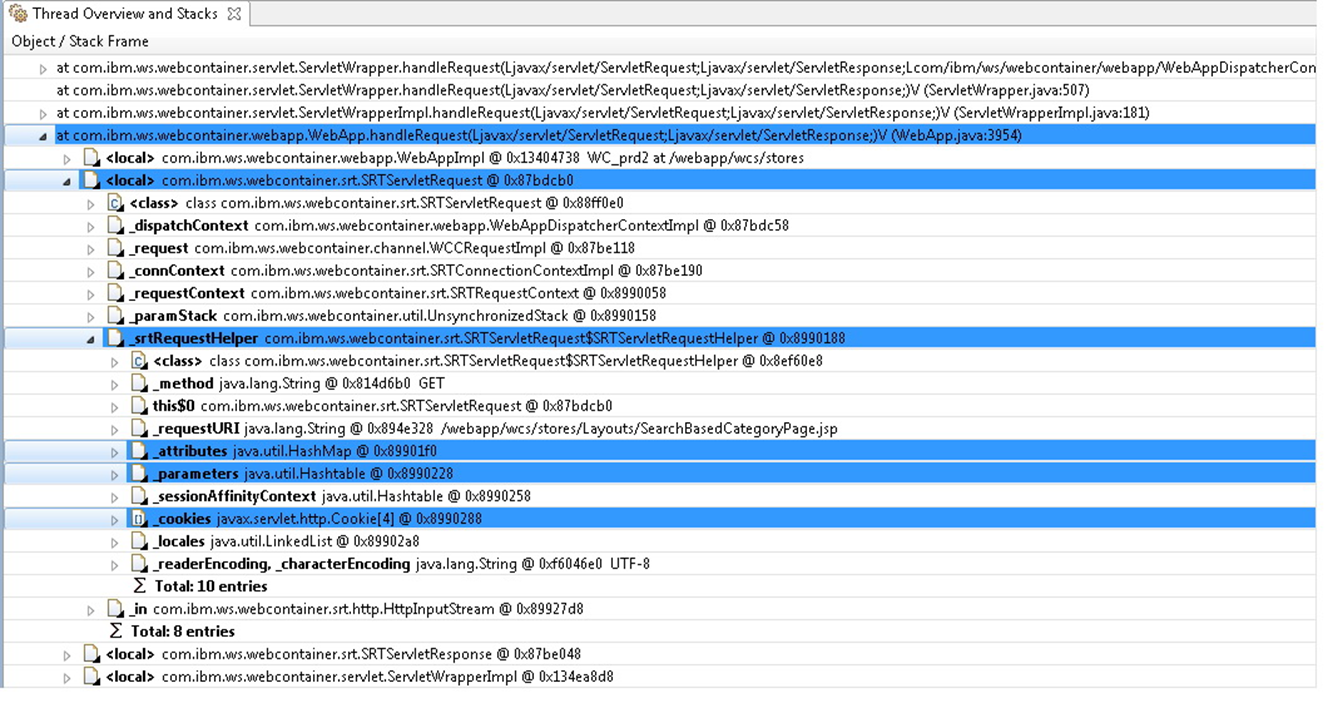
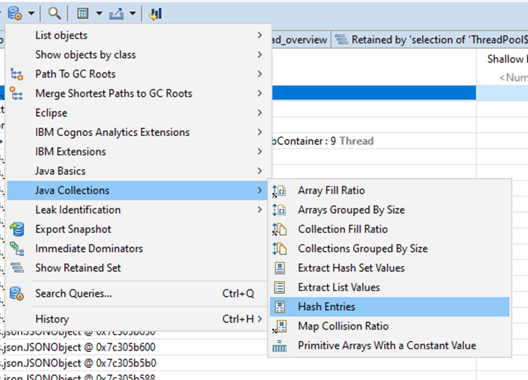
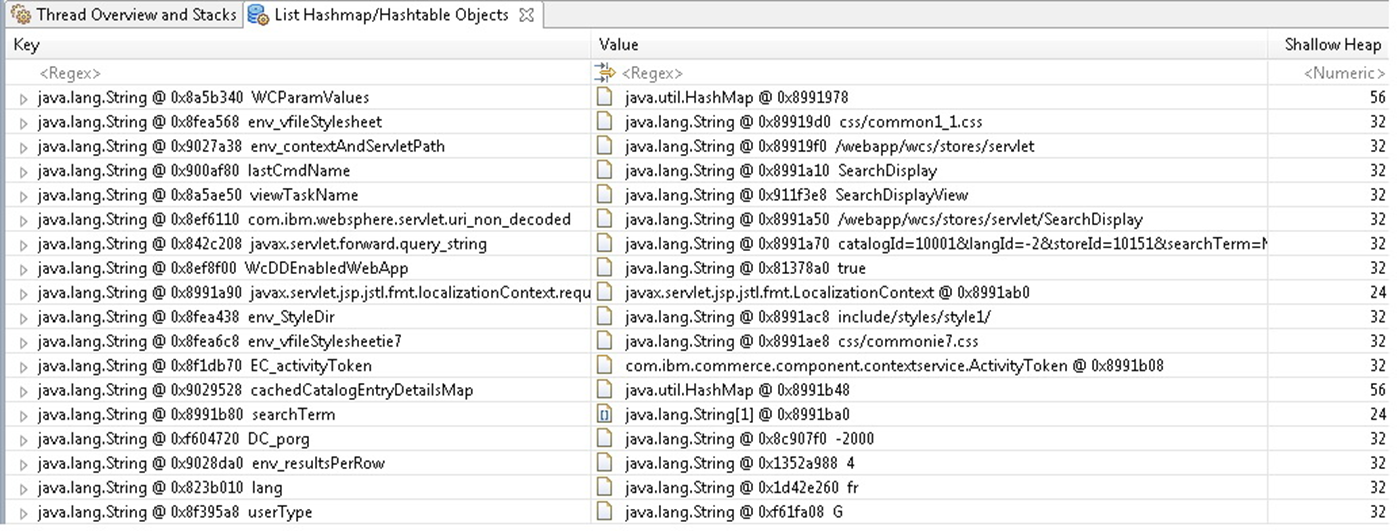
_srtRequestHelper provides additional information for the request. This information includes attributes, parameters, cookies, etc. If the object is a HashMap, you can use to list the contents in a table format:
- Sample 2
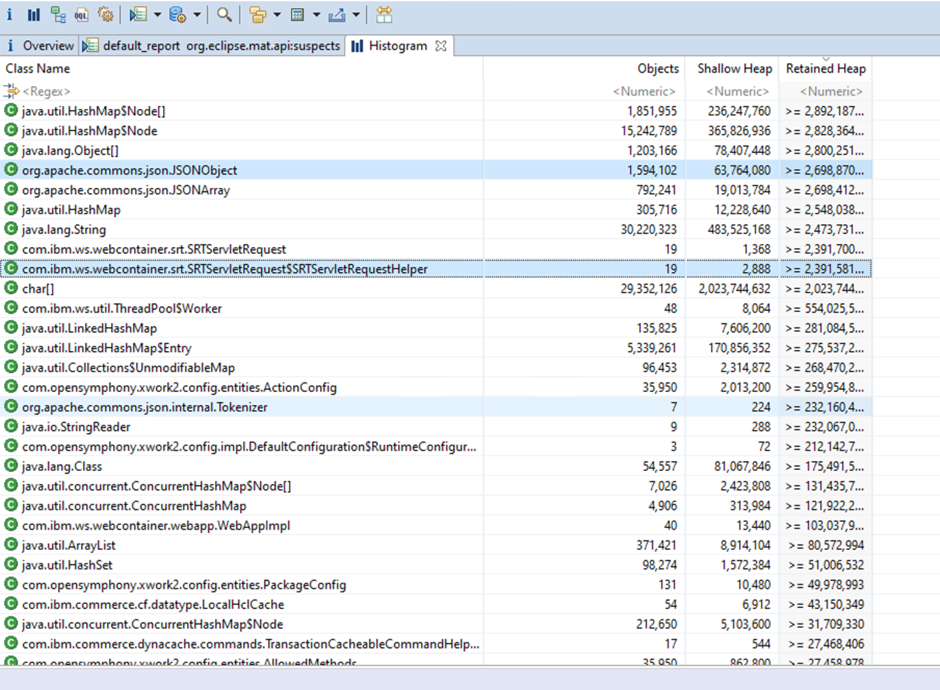
- After opening the native core in MAT, use the Histogram and sort on the retained
heap. This sample shows that some large JSON objects are associated with
ServletRequest, that is, WebContainer request.
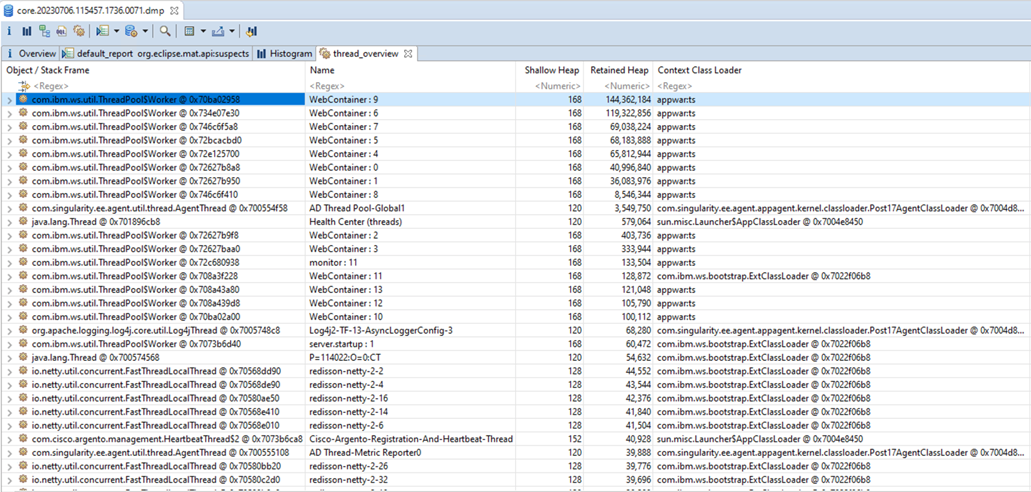
Listing Thread Details:
Use the to list the threads.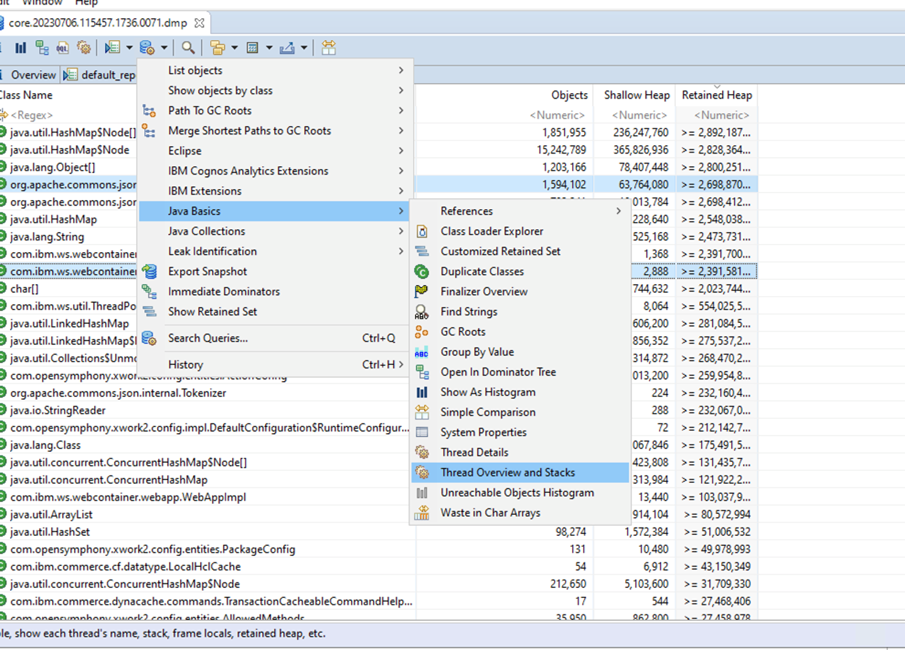
In the following sample, WebContainer 9 is using 144 MB of the heap.
Utilize the Retained Set feature to show the objects associated with the thread.
In the following sample, the json object is 109 MB which is extremely large.
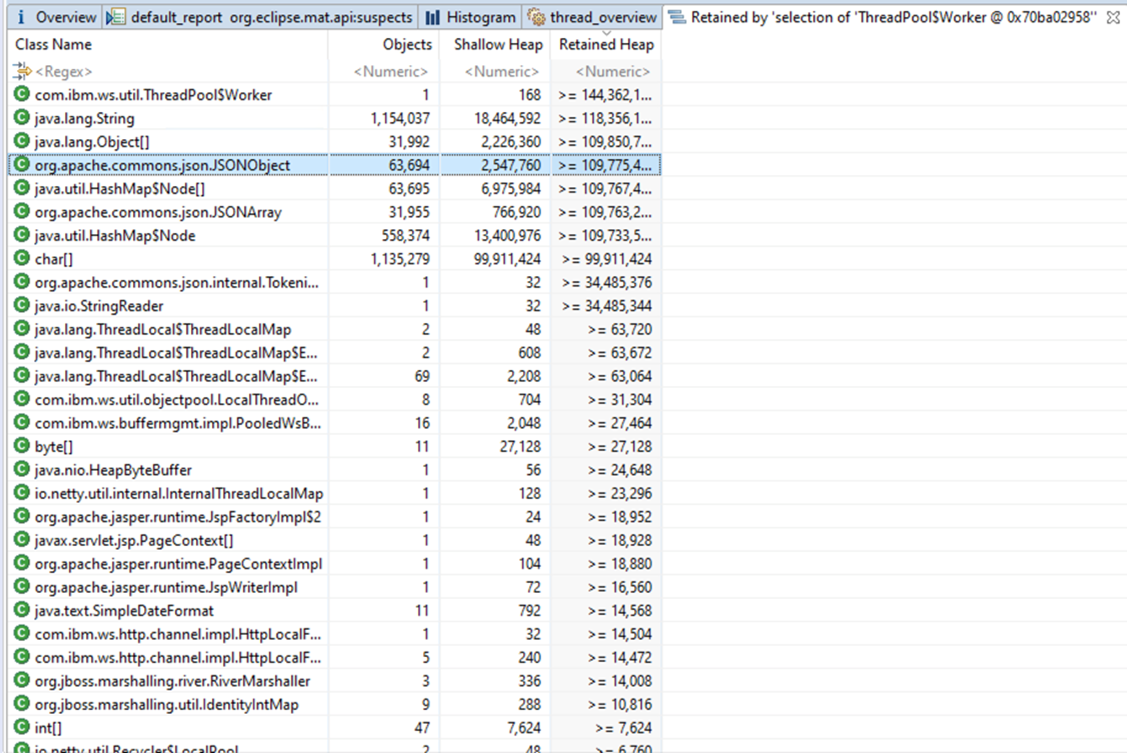
To see exactly what is in the json object, you can use the to see the contents of the json. This will give you an idea of why the object is so big.