
Analytics Dashboard - Visitors
User will be able to view the dashboard in Management Center only after completing the dashboard configuration. Visitors page display information about the Shoppers visiting the selected store.
Visitors page provides information on the overall Shoppers, pageviews, the mode shoppers are using to visit the store, and so on.
Once configured, login to Management Center. From Hamburger menu, select
Analytics. Analytics dashboard overview page will be
displayed. Click on Visitors to get more information about
shoppers. The Visitors page will be displayed as shown below: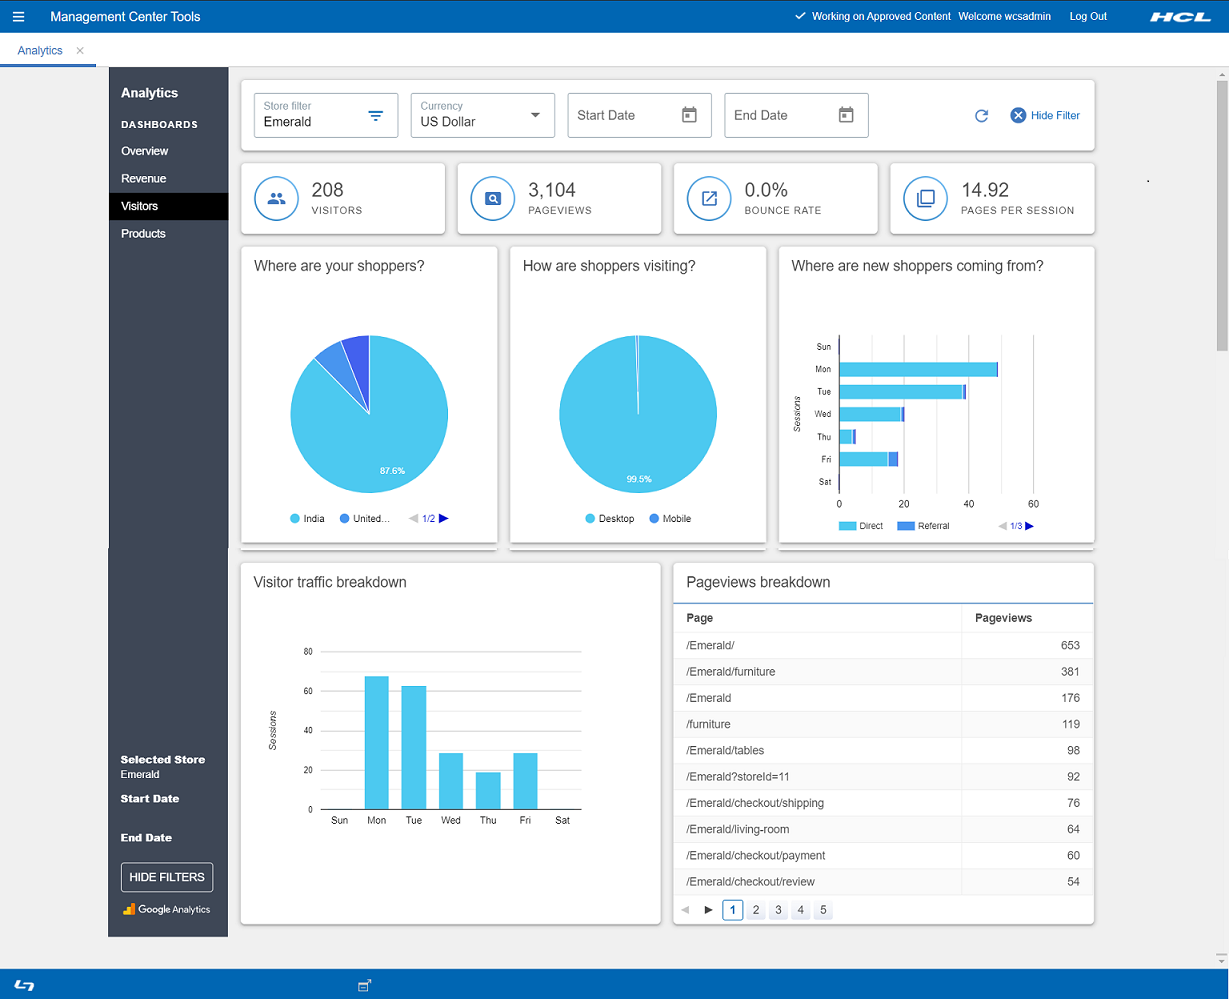
- B2C (Consumer Direct)
- B2B (B2B Direct)
- BBB (Basic B2B Direct)
- BMH (B2B Hosted store)
- BRH (B2B reseller store)
- MHS (Consumer direct hosting store)
- RHS (Reseller Hosted store)
- SUS (Supplier Hosted Store)
Select Dates from the calendar. Data will displayed based on the Start Date and End Date selected for the store.
 Note: Analytics has a number of standard and calculated metrics
that are considered currency values. The global currency type of a property
(GA4) or reporting view (UA) determines the currency in which all of these
values are displayed in reports. By default, the global currency type of a
property or reporting view is USD. Businesses that transact in a single currency
other than USD can configure a property or reporting view to use any of the
supported currencies in the Property Settings or View Settings page. See [GA4] Currency reference - Analytics
Help for more information.
Note: Analytics has a number of standard and calculated metrics
that are considered currency values. The global currency type of a property
(GA4) or reporting view (UA) determines the currency in which all of these
values are displayed in reports. By default, the global currency type of a
property or reporting view is USD. Businesses that transact in a single currency
other than USD can configure a property or reporting view to use any of the
supported currencies in the Property Settings or View Settings page. See [GA4] Currency reference - Analytics
Help for more information.The data shown on the dashboard is displayed for the selected store. User can click on the Refresh button shown on the right top corner of the page to get the updated data from the store.
Click Hide Filters, and all the filters will disappear from the screen. To See the filters again, click either on Refresh icon, or Show filters given at the left bottom of the page.
The total number of visitors on the store are shown in the Visitors.
Page Views displays the number of times shopper have viewed a page.
The percentage of the single page session is shown as Bounce Rate. It records the sessions in which a shopper left the store after viewing a single page.
The average number of pages viewed during a session, including repeated views of a single page is shown in the Pages per session
All the countries from where the shopper had visited the store is shown in the Where are your shoppers?
The method from which the shopper is visiting the store is shown in the How are shoppers visiting? It will show all the modes shoppers use to visit the store.
Where are new shoppers coming from? shows the total sessions of the day of the week, and how shoppers are visiting the store.
In the Visitors Traffic Breakdown graph, it shows the day of the week, and how shoppers are visiting the store.
In the Pageview Breakdown, you can view the total number of times the visitor viewed the page.
| Term | Description |
|---|---|
| Page | Name of the page from the selected store. |
| Pageviews | The number of times a page from selected store is viewed by the visitor. |