
Analytics Dashboard - Revenue
User will be able to view the dashboard in Management Center only after completing the dashboard configuration. Revenue page displays an information related to the revenue generated by the selected store.
Revenue page provides information on revenues by different categories, such as Country, Channel,Category, and Product.
Once configured, login to Management Center. From Hamburger menu, select
Analytics. Analytics dashboard overview page will be
displayed. Click on Revenue to get more information on
revenue. The Revenue page will be displayed as shown below: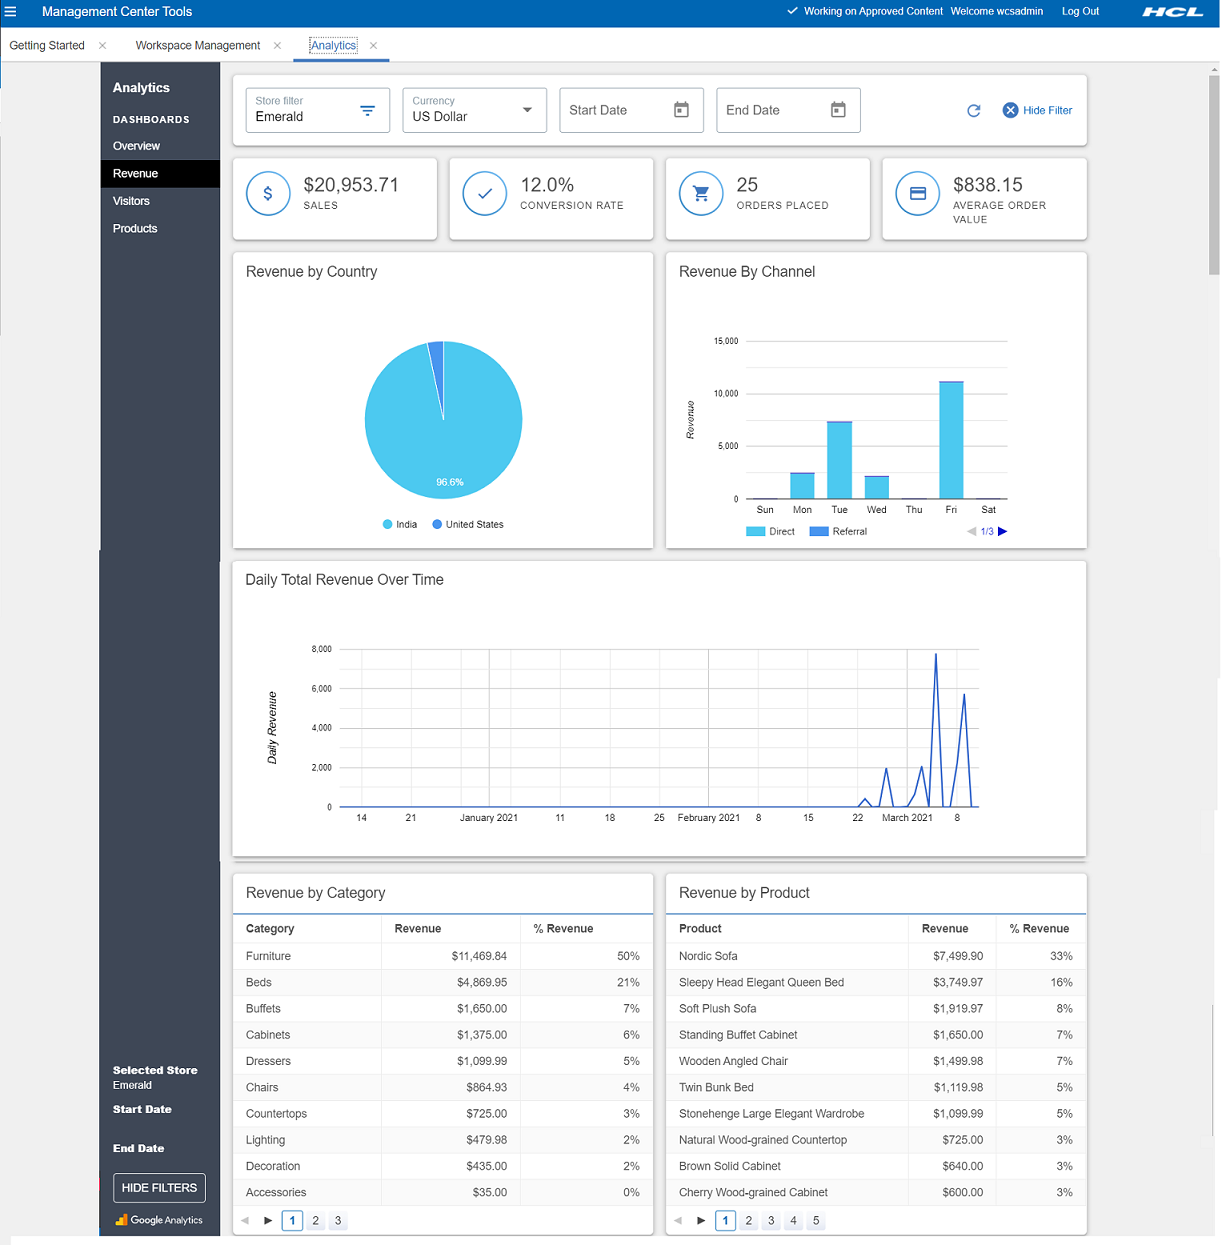
- B2C (Consumer Direct)
- B2B (B2B Direct)
- BBB (Basic B2B Direct)
- BMH (B2B Hosted store)
- BRH (B2B reseller store)
- MHS (Consumer direct hosting store)
- RHS (Reseller Hosted store)
- SUS (Supplier Hosted Store)
 Note: Analytics has a number of standard and calculated metrics
that are considered currency values. The global currency type of a property
(GA4) or reporting view (UA) determines the currency in which all of these
values are displayed in reports. By default, the global currency type of a
property or reporting view is USD. Businesses that transact in a single currency
other than USD can configure a property or reporting view to use any of the
supported currencies in the Property Settings or View Settings page. See [GA4] Currency reference - Analytics
Help for more information.
Note: Analytics has a number of standard and calculated metrics
that are considered currency values. The global currency type of a property
(GA4) or reporting view (UA) determines the currency in which all of these
values are displayed in reports. By default, the global currency type of a
property or reporting view is USD. Businesses that transact in a single currency
other than USD can configure a property or reporting view to use any of the
supported currencies in the Property Settings or View Settings page. See [GA4] Currency reference - Analytics
Help for more information.Select Dates from the calendar. Data will displayed based on the Start Date and End Date selected for the store.
The data shown on the dashboard is displayed for the selected store. User can click on the Refresh button shown on the right top corner of the page to get the updated data from the store.
Click Hide Filters, and all the filters will disappear from the screen. To See the filters again, click either on Refresh icon, or Show filters given at the left bottom of the page.
Sales displays the total revenue of the selected store. The further information per category is shown as Revenue in the image above.
The total percentage of the interest applicable on the conversion is shown as Conversion Rate.
Total number of orders customers have placed is shown inside Order Placed.
The average of all orders placed within the selected date range is shown as Average Order Value per order.
In the Revenue By Country, user will be able to view the total revenue generated by the customers of the countries visited the selected store.
In the Revenue by Channel, you can view the revenue generated by the day of the week in different channels..
Daily Total Revenue Over Time displays the total revenue generated during the selected period of time in the graphical form.
| Term | Description |
|---|---|
| Category | Name of the products category customers are viewing in the store. |
| Revenue | The total sum of the revenue generated by the product category for selected store. |
| % Revenue | The percentage of the revenue generated by the product category for the selected store. |
| Term | Description |
|---|---|
| Product | Name of the products customers are viewing in the store. |
| Product Revenue | The total sum of the revenue generated by the product for selected store. |
| % Revenue | The percentage of the revenue generated by the product for the selected store. |