
Analytics Dashboard
User will be able to view the dashboard in Management Center only after completing the dashboard configuration.
The display of the dashboard will be saved as a preference for each user. The first time a user logs on it will be displayed by default. If the user closes the dashboard, the preference will be saved to save that state. The dashboard can be opened from the hamburger menu and the new state will be saved as a preference for that user.
Analytics dashboard utilizes data provided to the selected store. However only limited users have an access to extended site.
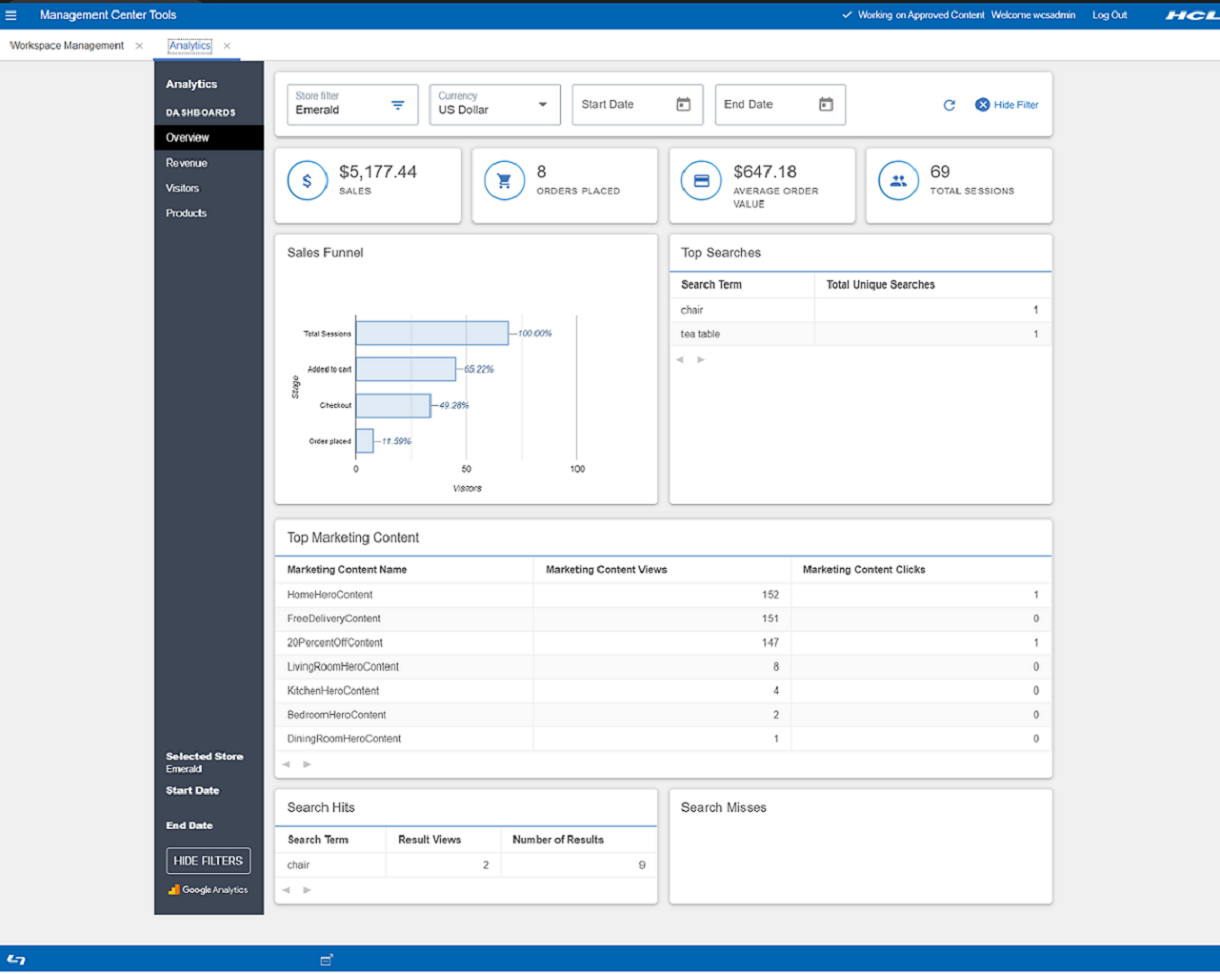
 The new dashboard has more information gathered from the selected
store. It provides more information with different tabs such as Overview, Revenue,
Visitors, and Products as shown in the image below. Click on different tabs to know
more information about selected store and it's related products.
The new dashboard has more information gathered from the selected
store. It provides more information with different tabs such as Overview, Revenue,
Visitors, and Products as shown in the image below. Click on different tabs to know
more information about selected store and it's related products.
 Note: Analytics has a number of standard
and calculated metrics that are considered currency values. The global currency
type of a property (GA4) or reporting view (UA) determines the currency in which
all of these values are displayed in reports. By default, the global currency
type of a property or reporting view is USD. Businesses that transact in a
single currency other than USD can configure a property or reporting view to use
any of the supported currencies in the Property Settings or View Settings page.
See [GA4] Currency reference - Analytics
Help for more information.
Note: Analytics has a number of standard
and calculated metrics that are considered currency values. The global currency
type of a property (GA4) or reporting view (UA) determines the currency in which
all of these values are displayed in reports. By default, the global currency
type of a property or reporting view is USD. Businesses that transact in a
single currency other than USD can configure a property or reporting view to use
any of the supported currencies in the Property Settings or View Settings page.
See [GA4] Currency reference - Analytics
Help for more information.- Site Administrator
- Customer Service Representative
- Seller
- Product Manager
- Marketing Manager
- Operations Managers
- Buyer (Buy-Side)
- Customer Service Supervisor
- Category Manager
- Logistics Manager
- Sales Manager
- Account Representative
- Workspace Manager
- Workspace Content Contributor
- Workspace Task-group Approver
- Marketing Director
Once configured, login to Management Center. From Hamburger menu, select
Analytics. Analytics dashboards will be displayed as
shown below: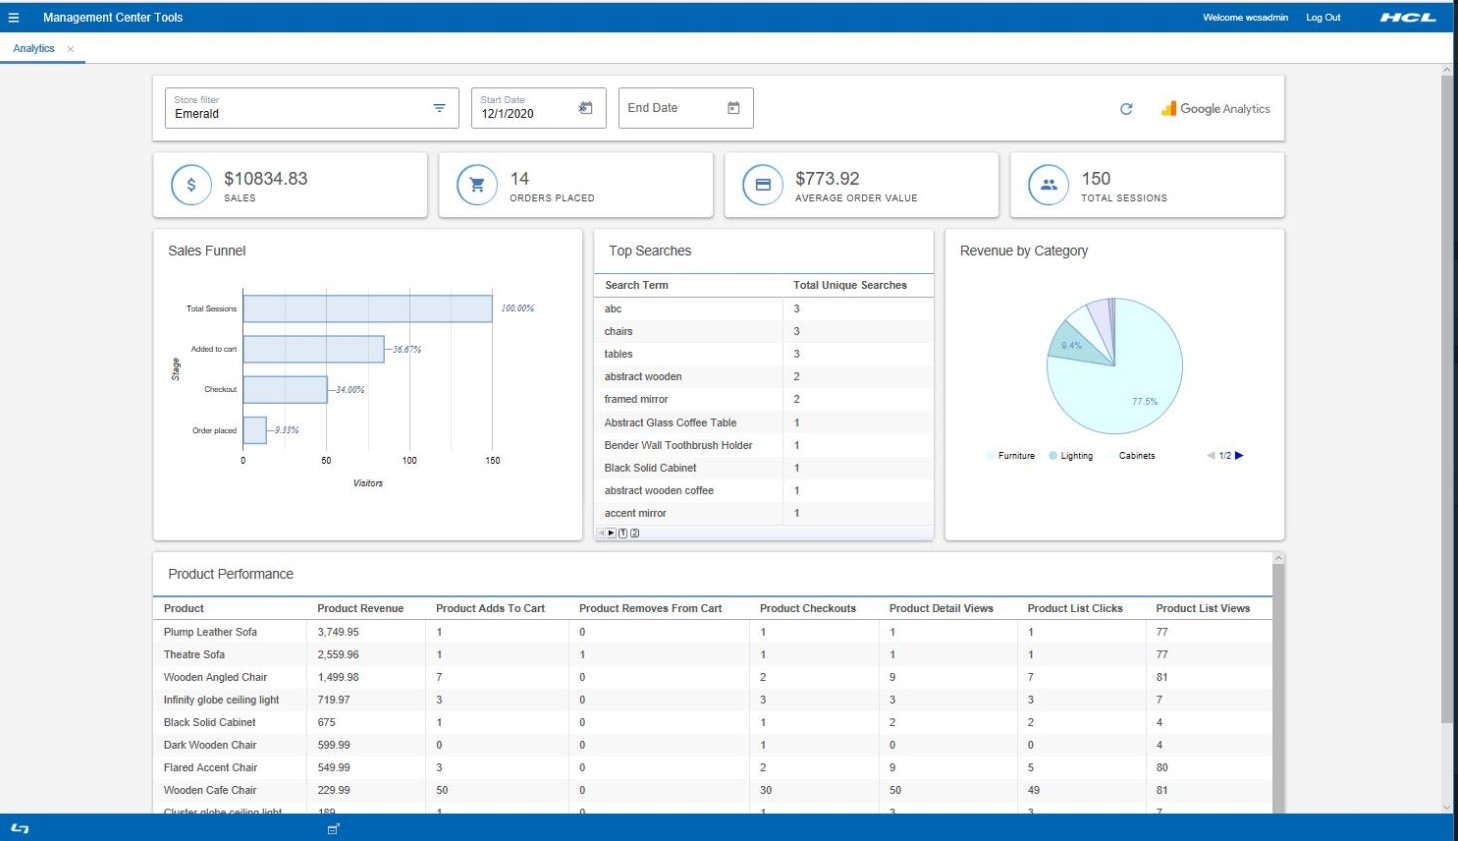
- B2C (Consumer Direct)
- B2B (B2B Direct)
- BBB (Basic B2B Direct)
- BMH (B2B Hosted store)
- BRH (B2B reseller store)
- MHS (Consumer direct hosting store)
- RHS (Reseller Hosted store)
- SUS (Supplier Hosted Store)
Select Dates from the calendar. Data will displayed based on the Start Date and End Date selected for the store.
Sales displays the total revenue of the selected store. The further information per category is shown as Revenue by Category in the image above.
Total number of orders customers have placed is shown inside Order Placed.
The average of all orders placed within the selected date range is shown as Average Order Value per order.
All customer visits, checkouts, product views will be calculated and shown as Total Sessions when customer visited the store.
In the Sales Funnel, user will be able to view the total order placed, checkouts, added to cart, and total sessions.
In the Top Searches, you can view the Search Term, and it's related number of Total Unique Searches.
| Term | Description |
|---|---|
| Product | Name of the products customers are viewing in the store. |
| Product Revenue | The total sum of the revenue generated by the product for selected store. |
| Product Added to Cart | The number of times when a product was added to cart. |
| Product Removes From Cart | The number of entries when a product was removed from the cart. |
| Product Checkouts | This shows the number of times when the product was checkout out by the customer. |
| Product Details Views | This shows the number of times when the product details was viewed by the customer. |
| Product Lists Clicks | This displays the number of times when the product was clicked by the customer from the list view. |
| Product List Views | This displays the number of times when the product was displayed from the list view. |
The data shown on the dashboard is displayed for the selected store. User can click on the Refresh button shown on the right top corner of the page to get the updated data from the store.