Create a Chart Tile
Use chart tile to visually represent data of various components.
When you work with bar charts on the Define Filters page, start by gathering the data for your chart by using the Add Condition and Add Value buttons. Then, use the fields in the Set Bars pane to visually represent the components of that data. The Create chart bars based on field prevents you from inadvertently duplicating the conditions used in the filter by disabling them in the drop-down list.
To create a bar chart:
- From the Overview page, select Edit Dashboard > Add Tile > Add Custom Tiles.
- Select Chart.
- Enter a name for your tile.
- Select an item (BigFix object) from the drop-down list, and click Set Bars.
- Specify the data conditions and values (filter criteria) for the chart.
- Click Add Condition.
- Select a condition from the drop-down list.
- Select a condition value. Click Add Value again to further refine your conditions.
- Use the Add Condition and Add Value buttons to specify more conditions as required.
- To include every instance of an object (for example, ALL Software Packages), proceed to Step 6.
- Click Add Condition.
- In the Set Bars pane, select a category for your chart from the
Create chart bars based on drop-down list. For example, categories for
patches include
Severity
,Operating System
,Issue Date
,Category
, andName or ID
. - Click the Add Bar button to create bars for the values in that category.
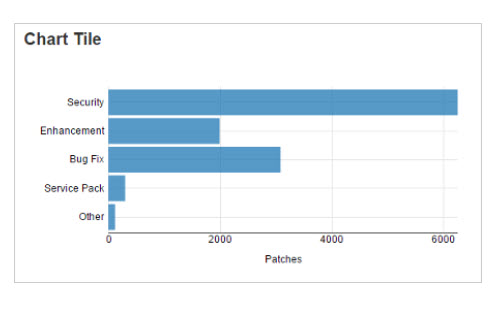
For example, in a chart that shows patch severity, make bars for
Critical
,Important
,Moderate
,Low
, andUnknown
. Type the bar's name in the field to the right of its value to label it. To delete a bar, click the X.- Bar names must be unique.
- To specify a date range, click in the bar field to display a calendar and select start and end dates.
- When you enter values for
Issued By
, type the operator's BigFix user name.
- Click Add to add the chart to the tile and return to the Build Tile page. Or click Back to exit without saving.
- On the Build Tile page, drag the bars to rearrange them, or click the X to delete a bar. Check the Preview pane to see your changes.
- In the field below the tile title, type a description of the chart's X axis.
- Click Done. On the Edit Dashboard page, move the new tile to the place you want it on the dashboard.