
Monitoring the operation
The NiFi and Elasticsearch heaps, and also native memory utilization, should be given special attention. If the memory size is inadequate for the workload, it must be extended. After each tuning adjustment, the heap and native memory use should be monitored. This is crucial when increasing processor concurrency or increasing bucket.size/flowfile size.
The Graphana NiFi Performance graph is the most convenient way to track the index's overall development. You can look at the total execution pace, determine the speed of major processor groups, and see how much data is generated and uploaded to Elasticsearch.
Grafana
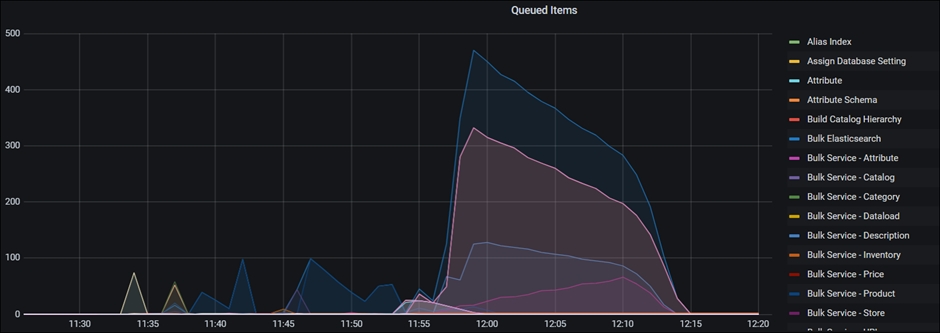
You can use Grafana to analyze the performance of the ingest pipeline. The two most useful graphs are Queued Items and Wait Link.
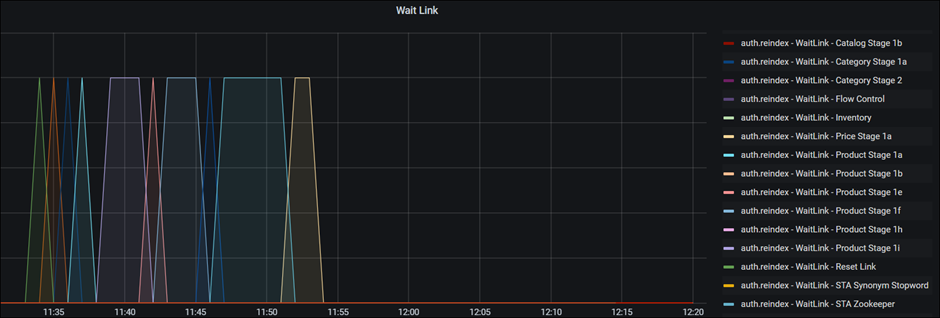
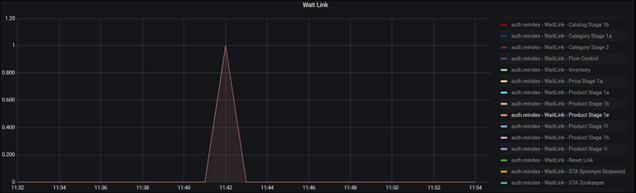
WaitLink process groups are added between process groups in the NiFi ingest connectors to ensure that the previous stage is completed before the subsequent stage is started. Data currently in use in an ongoing process cannot be used in subsequent stages. Furthermore, this reduces the probability of multiple processes operating at the same time, which might result in significant spikes in CPU, network, memory, or disc IO resource requests.
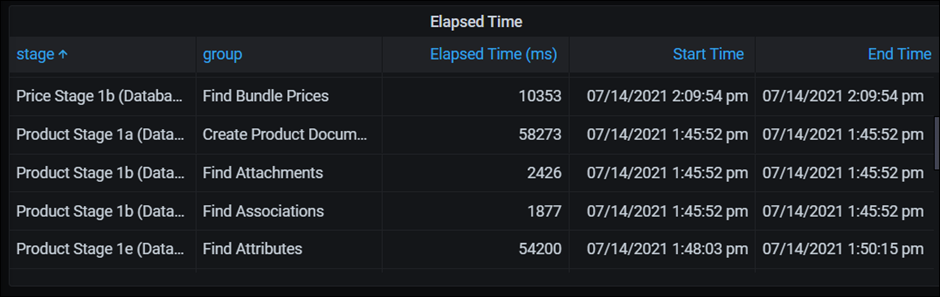
The time spent on WaitLink can be used to estimate the total time spent on a stage and identify the stages that consume the most time and/or resources during the build. Since WaitLink is not available for all process groups, the Queued Items graph offers more details about the processing time for each process group.
The Bulk Service <- XXXX> charts are useful to look at within Queued Items. The processed data (index documents) is sent from NiFi to Elasticsearch by these process groups. Bulk Service - Product is the most essential. Use the timestamp in WaitLink to access the corresponding stages because the curve runs from the beginning to the finish of the ingest pipeline.
The next two graphs, for example, illustrate that the Product Stage 1e has the most queued items. This observation indicates that the retrieving data group and the processing data group are capable of handling the task rapidly and sending large amounts of data to the Bulk service group for transmission.
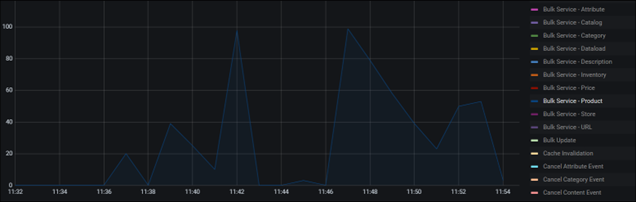
The duration with 100 queued items is short in this example, thus it is not a concern. A possible bottleneck in the pipeline would be a process group that takes longer and has a larger number of queued items.
Grafana may also be used to track other parameters.
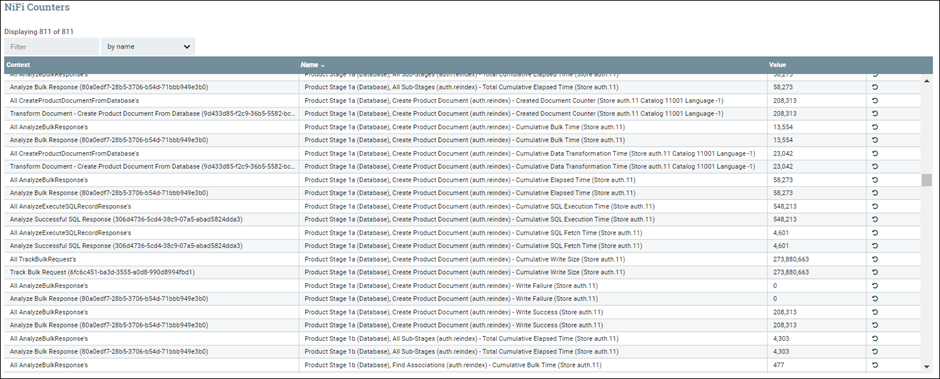
NiFi counters and reporting
When running an ingest pipeline, you can verify the pipeline report using NiFi counters or Grafana.
Due to high resource consumption, the NiFi counters access
http://nifi.<your domain>/nifi/counters is disabled by
default.
/commerce-helmchart-master/hcl-commerce-helmchart/stable/hcl-commerce/templates/nifi-app.yaml
before installing NiFi:- name: "DOMAIN_NAME"
value: "{{ .Release.Namespace }}.svc.cluster.local"
- name: "SPIUSER_NAME"
value: {{ $.Values.common.spiUserName | quote }}
- name: "FEATURE_NIFI_COUNTER"
value: "true"
- name: "VAULT_CA"
value: {{ .Values.vaultCA.enabled | quote }}
Examine the report while the test is ongoing or after the ingest process is done if you enable it. One disadvantage is that each connection can only display one report. By using the same connector, another ingest pipeline can be run at the same time (please allow a couple of minutes for this to complete). Once the ingest pipeline starts, the report created for the previous run is deleted.
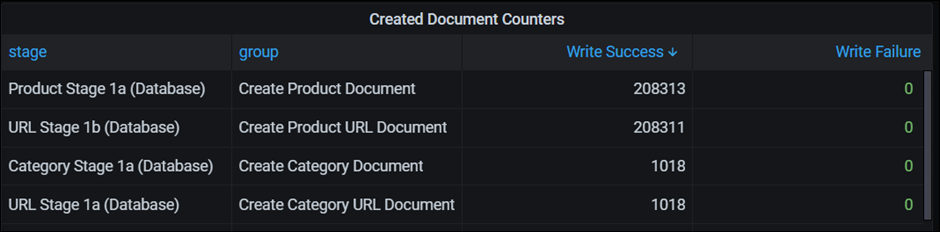
The ingest report, Ingest Metrics, is sent to the index run within Elasticsearch once an ingest pipeline is completed. Grafana can be set up to display the report in the format you specify. All of the reports for the various ingest pipelines and connections are saved. To view the report, select connector and runID.
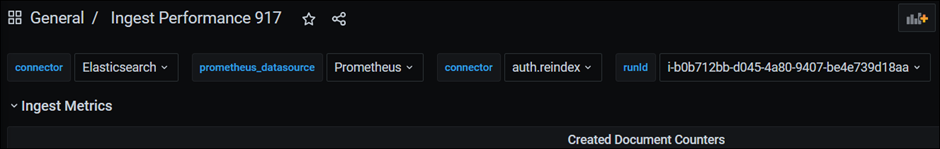
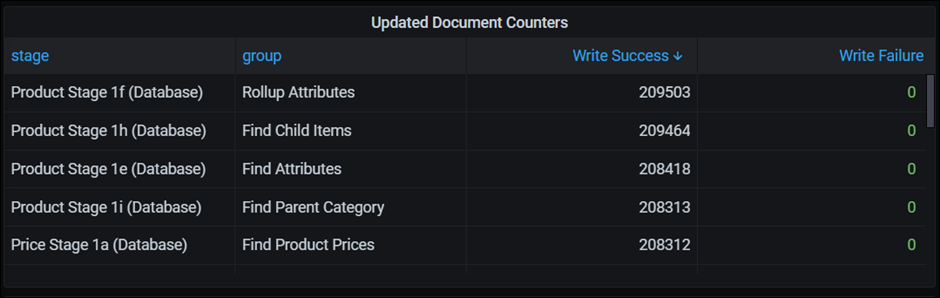
At Grafana, the data for Ingest Metrics differs from that for Queued Items/ Wait Link. Elasticsearch receives the metrics from NiFi after the ingest process is complete. However, Queued Items/ Wait Link uses Prometheus to collect data in real time.
You may not want to finish an ingest pipeline before running it again for tuning purposes, or the process could fail at any time throughout the ingest process. In these circumstances, NiFi counters may make reporting for particular stages of an ingest pipeline easier.
Kibana
Kibana can be used to monitor the resource consumption of Elasticsearch. For more information about Kibana, see Kibana documentation.
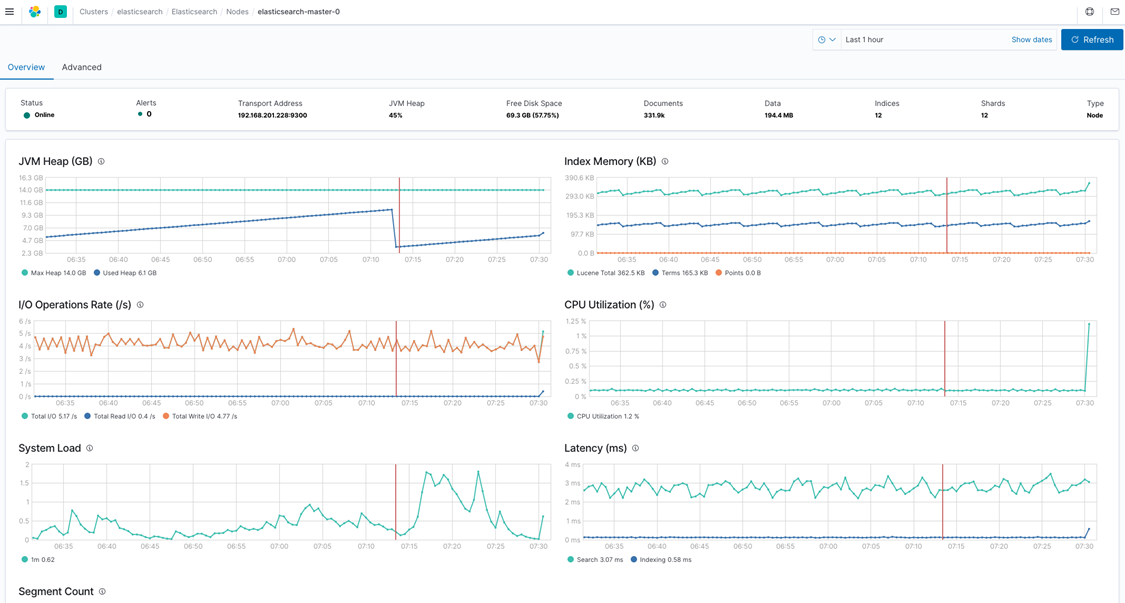
Kibana is monitoring Elasticsearch activities in this graph. The CPU usage, JVM heap, and IO operations rate are the key metrics for the index building process. The IO operation rate is the main metric since it is difficult to push faster overall throughput if the IO rate is fully utilised. If the speed is unacceptable, the best course of action is to look into other options that have a higher throughput.