
Total Operations dashboard
The total operations dashboard displays a breakdown of the total number of index, search, get, and delete operations carried out on your Elasticsearch cluster.
The dashboard visualizes the number of operations performed on your Elasticsearch cluster, broken down by index, search, get, and delete operations.
-
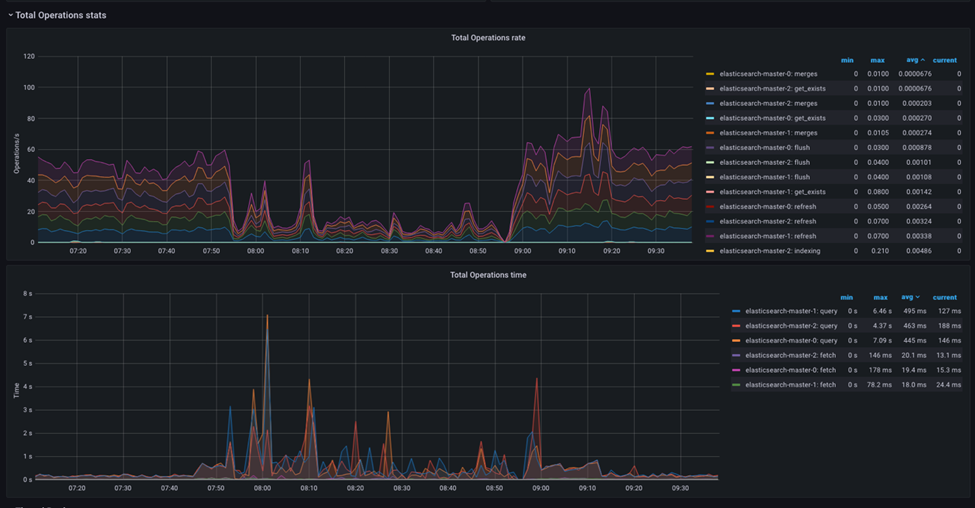
- Total Operations rate
- This dashboard shows the rate at which operations are being performed on your Elasticsearch cluster, broken down by index, search, get, and delete operations.
-
- Total Operations time
- This dashboard shows the total time each operation took, broken down by index, search, get, and delete operations.
This can help you identify operations that are taking longer than expected and that may require optimization.
Monitoring and Analysis of a typical problem
One can observe the Elasticsearch operations and tune them for a single type of workload or a mix of various operations workloads. Tuning Elasticsearch for a single type of workload is relatively easy and straightforward.
When you have a mix of operations, for example building the index and processing production search requests, the success of the tuning depends on how well the workload mix is understood and simulated in the performance testing environment.
The following section describes the straightforward workload tuning of the instance for creating an index on Elasticsearch. Before attempting to tune live traffic, this will likely be the team's initial tuning test.
Single type operations of Elasticsearch
- High CPU usage
- If Elasticsearch uses a high percentage of the CPU during indexing, you can add more CPU resources to your cluster. You can also check if any poorly performing queries or indexing processes consume more CPU resources than expected.
- High memory usage
- If Elasticsearch uses a large amount of memory during indexing, you can add more memory resources to your cluster. You can also check if poorly performing queries or indexing processes consume more memory resources than expected. In addition, you can monitor the memory usage of Elasticsearch caches, such as the field data cache, and adjust the cache size accordingly.
- Slow indexing rate
- If the indexing rate is slower than expected, it may indicate that Elasticsearch is short on resources, such as CPU or memory. You can check the CPU and memory usage metrics to see if they are close to their limits. If so, you may need to add more resources to your cluster. You can also check if any queries or indexing processes are causing bottlenecks or if there are any network or disk I/O issues.
- High disk I/O
- If the disk I/O is high during indexing, you can add more disk resources to your cluster. You can also check if poorly performing queries or indexing processes are causing high disk I/O. In addition, you can monitor the disk space usage and adjust the Elasticsearch configuration settings, such as the shard size, to optimize the disk usage.
- Elasticsearch logs
- Elasticsearch logs can provide valuable information about errors, warnings, and other issues related to resource shortages. You can check the Elasticsearch logs to see if there are any error messages related to resource shortages and take appropriate actions to address them.
By monitoring these metrics and analyzing the patterns and trends over time, you can determine if Elasticsearch is short on resources and take appropriate actions to optimize your cluster performance during the indexing process.
The case of low heap
When Elasticsearch is low on heap, it can cause various issues, such as slow response times, increased latency, and even crashes. These unstable behaviors can be exhibited when executing a single task on Elasticsearch or when multiple concurrent tasks are executed simultaneously on Elasticsearch, such as in index building and the search requests service.
-
- Increased Garbage Collection (GC) activity
- Elasticsearch's garbage collector must run more frequently to reclaim memory as the heap fills up. This can increase CPU usage, cause longer GC pauses, and air performance.
-
- Reduced cache size
- Elasticsearch uses various caches to speed up searches and queries. When the heap is low, the cache size may be reduced or even disabled, resulting in slower search times.
-
- Increased disk I/O
- If Elasticsearch unable to fit all of its data in memory, it may need to swap data to disk, resulting in increased disk I/O and slower performance.
It is important to note that Elasticsearch es native memory for various caches and storage repositories. The typically recommended setup for Elasticsearch heap is to allocate 50% of the pod memory to JVM Heap space. Leave the other 50% to the native memory and file cache.
Additional considerations arding memory consumption.
- Bulk size
- Using bulk requests can significantly improve indexing performance when indexing multiple documents at once. However, the size of the bulk requests can also affect performance. If the bulk size is too large, it can cause resource exhaustion and slow down the indexing process. If the bulk size is too small, it lead to more requests and slower overall performance.
There is no correct size of the bulk request. Test with different settings for the bulk request size to find the optimal size for your workload. This configuration can be performed by setting the NiFi flow file size, which will, in turn, reflect directly on the bulk request size that NiFi will make to Elasticsearch.
It is important to note that Elasticsearch limits the maximum size of an HTTP request to 100 MB by default, so you must ensure that no request exceeds this size.