
Key monitoring metrics
The query time dashboard and CPU utilization dashboard are the two primary monitoring metrics that will enable you to monitor the Elasticsearch (ES) cluster and identify changes over time dynamically.
The following two critical monitoring metrics allow you to dynamically monitor the Elasticsearch cluster and spot variations over time:
- Query time dashboard
- CPU utilisation dashboard
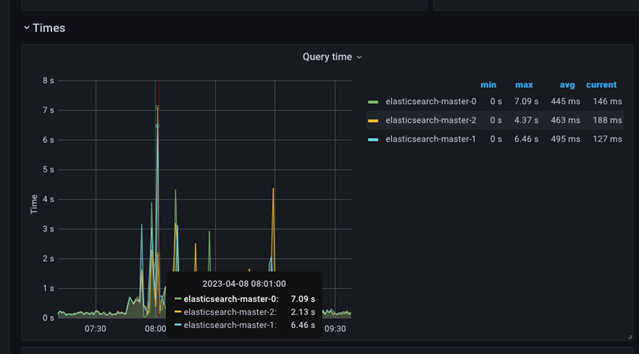
The following screenshots display a given time slice's query time and processing time. The minimum, maximum, and average values are shown in the side table, while the graph presents the maximum values.
The chart is simple to understand and can be used to quickly identify issues. Any sudden jump in the max query time values would indicate a severe problem in the cluster, and further investigation is mandatory. The graph depicts a situation where the query processing time is disturbed for a more extended period, and this period should be correlated with the other displays to determine the source of the problem.
Sudden spikes and then a return to normal are also possible. These spikes are usually due to external events impacting the query processing time.

Moving the mouse cursor over the image provides the actual values for that time interval.
- CPU Utilisation
- This Dashboard is so a critical dashboardthat can alert you to unusual behavior or a difficulty of the system to cope with the current workload.
Resource consumption
The resource consumption group ovides in-depth information on the Elasticsearch cluster operations and resource availability. The steady state of operation should be well understood, and any deviation from the steady state should present an alert for potential threats or instability in the system that needs to be investigated.
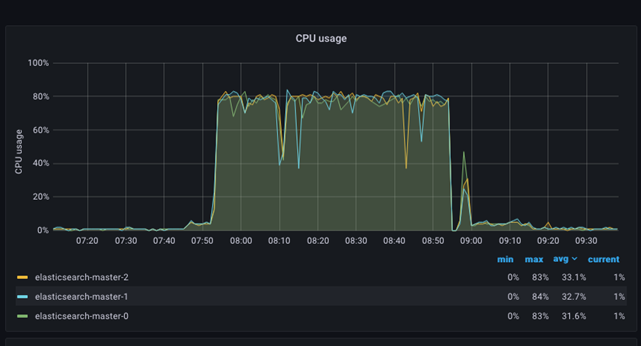
CPU utilisation
The CPU age graph is relatively simple. It presents each ES node as a separate color in the graph and, at the same time, presents a table with min, max, and average values for each node in the ES cluster. Detecting situations where the CPU is very high (starvation) or low (contention and slowdown in the processing rate) is easy and noticeable. The following picture shows how the CPU utilization jumps to 80%+ while the traffic and indexing are performed on the site.

Network
The network resources graphs are relatively simple but will provide additional data and easy determination if an excess requests volume is fluencing operations.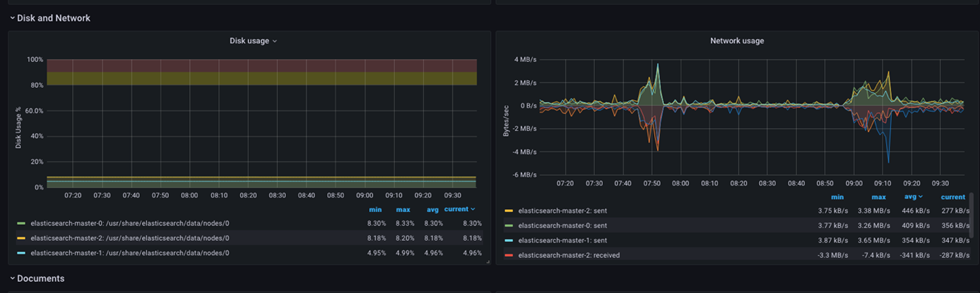
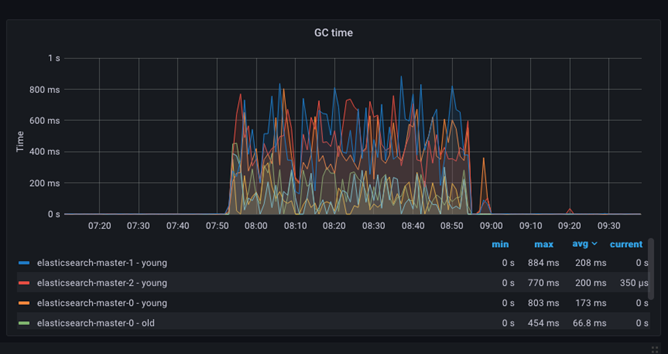
Garbage Collection operations – GC time
The JVM heap and garbage collection (GC) timing may be tracked using the GC time dashboard. This dashboard displays the amount of time used to clear the JVM heap of dead objects in order to make space for new allocations. The operation sually represents a 10% overhead and its effect negligible.
JVM Memory Utilisation
Memory allocation and heap space expansion in the Java Virtual Machine (JVM) can be tracked by the memory age dashboard. An example is presented in the following graph:
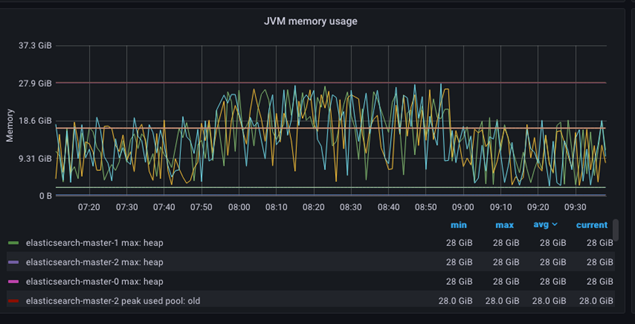
The total heap space is overreported and could be confusing. Multiple metrics are reported, but due to the ES heap setup (min=max), only the Elasticsearch-master-NNN used heap is displayed.
The general expectation is that the used heap metrics will be below the max heap metrics, while the CPU utilization chart will depict normal and steady resource consumption. The GC Time chart should display low overhead and a short time spent doing the garbage collection.
However, if the used heap metric is frequently maximum and close to the max heap metric, steady operation is still present. This indicates that the overall heap in ES is insufficient and should be increased.