
Active threads dashboards
Thread pool dashboards display real-time information about worker threads and their operations on the cluster, with metrics including the number of tasks waiting to be executed and the number of active threads. Understanding the role of each thread pool, such as the Generic, Search, Bulk, Index, GET, Write, and Analysis pools, is crucial for troubleshooting problems and optimizing performance in Elasticsearch (ES). Additionally, the field data and query caches help speed up search operations but may need to be cleared periodically, causing temporary slowdowns.
Thread pool dashboards display real-time information about the worker threads and how they operate on the cluster. The information is on a cluster level, but each thread group is shown per ES node.
- Thread pool operations queued.
- Thread pool threads active.
Thread pool operations queued indicates the number of tasks waiting to be executed, while Thread pool threads active indicates the number of threads executing tasks. Both metrics are essential for monitoring the health and performance of Elasticsearch.
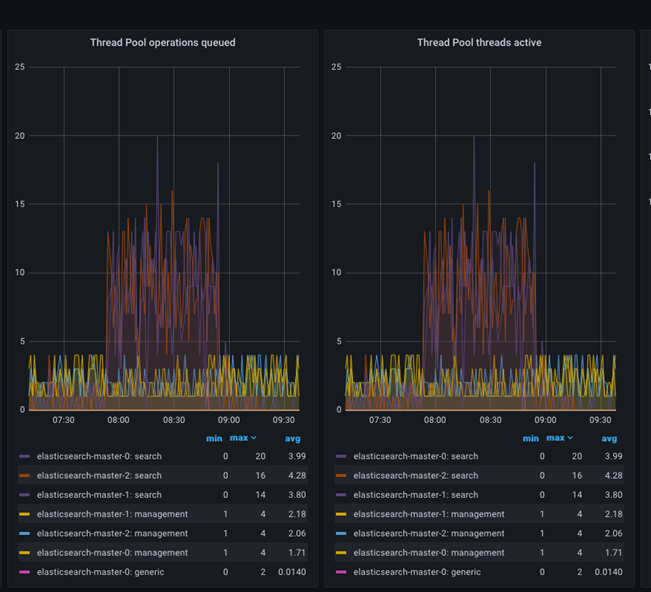
The Thread pool operations queued metric indicates the number of tasks waiting to be executed by the thread pool. This can happen when the number of tasks submitted to the thread pool exceeds the maximum number of threads available to execute them. When this happens, tasks are placed in a queue and are executed as soon as a thread becomes available.
The Thread pool threads active metric indicates the number of threads that are actively executing tasks. When this number is close to the maximum number of threads available, it can indicate that the system is under heavy load and may be experiencing performance issues.
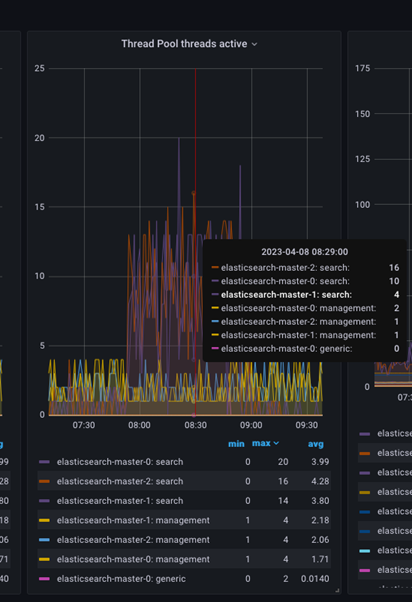
You can further inspect the active threads by placing the mouse pointer over the graph at a specific time to get the count of active threads at that specific time, as shown in image below.
- Generic thread pool
- This thread pool runs tasks that do not fit into any specialized thread pool. The generic thread pool runs internal tasks within Elasticsearch, such as sending and receiving network requests.
-
- Search thread pool
- This thread pool is used to run search requests. It handles tasks related to search operations, such as querying and filtering data. The number of threads in the search thread pool is typically set to the number of available CPU cores on the Elasticsearch node.
-
- Bulk thread pool
- This thread pool runs bulk indexing requests. It is responsible for handling tasks related to indexing large volumes of data.
-
- Index thread pool
- This thread pool runs indexing requests that are not performed in bulk. It is responsible for handling tasks related to indexing individual documents.
-
GETthread pool- This thread pool is used to run
GETrequests. It is responsible for handling tasks related to retrieving individual documents.
-
- Write thread pool
- This thread pool runs write-related operations, including indexing, updating, and deleting documents. It handles tasks related to writing operations that cannot be executed on the Bulk thread pool or the Index thread pool.
-
- Analysis thread pool
- This thread pool is used to run analysis tasks. It handles tasks related to analyzing text, such as tokenization and filtering.
-
- Snapshot thread pool
- This thread pool runs snapshots and restores operations. It is responsible for handling tasks related to backing up and restoring data.
Note: The number of threads in the Bulk, Index, GET, Write, Analysis and Snapshot thread pools is typically set to a small number, such as 1 or 2, to prevent the system from overloading.
Each thread pool has its settings, such as the maximum number of threads and the queue size, which can be configured to optimize performance based on the specific needs of your Elasticsearch deployment.
The write thread pool and the search request thread pool are the two most essential threads that must be closely watched and aged. Depending on the workload level and workload mix, appropriate settings for each thread pool may be required to control the workload flow and keep the cluster in stable operation.
Elasticsearch internal caches:
-
- Field data cache
- The field data cache is used to cache field values for frequently accessed fields, and it helps to speed up sorting aggregations and scripted fields. The field data cache is implemented as a soft reference cache, which means that the cache can be cleared by the garbage collector when memory becomes scarce.
-
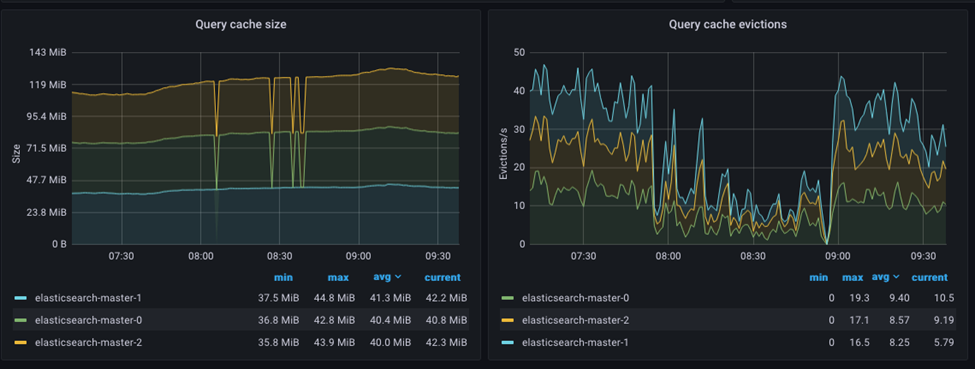
- Query cache
- The query cache is used to cache the results of frequently executed queries and helps speed up search operations. The query cache is implemented as an Least Recently Used (LRU) cache, which means that the least recently executed queries are evicted from the cache when it becomes full.
The field cache, for example, will be cleared whenever an index refresh or index merging operation is carried out, necessitating a new load of field values from the disc to memory. Whenever a reindexing operation is performed, such as when a new document is added or changed the index, the query cache will be deleted entirely.
It is important to note that clearing the cache can cause a temporary slowdown in performance, as the cache will need to be re-populated with new data.