
Monitoring and understanding Elasticsearch and NiFi metrics
You can use Grafana and related tools to analyze the performance of the Ingest pipeline, and Kibana to do the same with Elasticsearch.
Due to high resource consumption Monitoring should always start with operating system resources, and their
utilization. Identify if there is a resource that is saturated, such as CPU
(processor utilization), IO (network, disk, or memory), Memory, and so on, on the
system level. This is the first step in the tuning exercise – to ensure that we are
not running the solution with system resources that are improperly configured,
consumed, or bottlenecked. The easiest way to monitor this is with Grafana, and
Kibana (for Elasticsearch specific metrics), or any other system level monitor (for
example, nmon). If a system resource is saturated,
adjustment in the environment is required before attempting further tuning. For
example, there is no point to tune processor threads/concurrency if there is not
enough CPU resource available in the system.
Special attention should be paid to the NiFi and Elasticsearch heap. If the heap size is inadequate for the workload, it will need adjustment. The heap utilization should be monitored after each tuning change. This is especially crucial when increasing the concurrency of processors, or changes to bucket.size/flowfile size. These heap values may be required to be adjusted for each change to these key performance variables.
The easiest way to observe the overall progress of the index building is via the Grafana NiFi Performance graph. We can observe the overall execution speed, identify major processor group speed, and view the amount of data that is generated and pushed to Elasticsearch.
Grafana
You can use Grafana to analyze the performance of the Ingest pipeline. The two most useful graphs are Queued Items and Wait Link. To set up these and other dashboards, refer to Extensible metrics for monitoring and alerts.
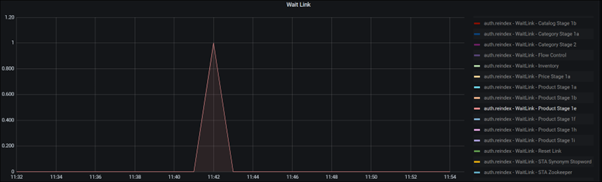
In the NiFi ingest connectors, WaitLink process groups are added between process groups to ensure that the previous stage is completed before the next stage is started. This way, subsequent stages will not use data that is currently being worked on in an unfinished process. In addition, this reduces the occurrence of different processes running at the same time, which can cause extreme spikes in resource requests for CPU, network, memory or disk IO.
The time that is spent on WaitLink can be used to estimate the full time that is used for a stage, and identify stages with the highest time and/or resource usage within the build. Since not all of the process groups have WaitLink, the Queued Items graph provides more details for the time taken for processing within each process group.
The useful charts to look at within Queued Items are the Bulk Service - <XXXX> charts. These process groups send the processed data (index documents) to Elasticsearch from NiFi. The most important one is Bulk Service – Product. Since the curve starts from the beginning to the end of the ingest pipeline, we can use the timestamp in Wait Link to get the related stages.
For example, the following two graphs show that the biggest number of queued items is at the Product Stage 1e. This observation means the retrieving data group and processing data group can handle the task quickly, and send lots of data to the Bulk service group for transferring.
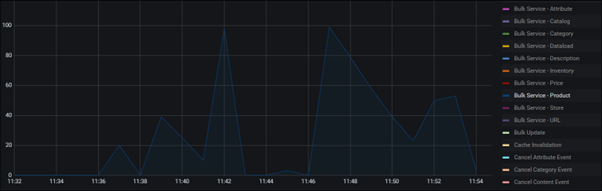
In this example, the duration with 100 queued items is short and therefore is not a problem. If a process group takes a longer time, with a larger number of queued items, it would be a possible bottleneck in the pipeline.
We can also use the Grafana to monitor other metrics.
Kibana
Kibana can be used to monitor the resource consumption of Elasticsearch. For more information about Kibana, refer to the Kibana documentation.
This graph displays Kibana monitoring Elasticsearch operations. For the index building process, the key metrics are the CPU utilization, JVM heap, and IO operations rate. The IO operation rate is the most critical metric, in the sense that if the IO rate is fully utilized, it is not possible to push faster overall throughput. If the speed is not acceptable, the best course of action is to investigate alternative solutions with higher throughput.
NiFi counters and reporting
When running ingest pipeline, we can use the NiFi counters or Grafana to check the pipeline report.
Due to high resource consumption, the NiFi counters collection for HCL Commerce activities are disabled by default.
name: "FEATURE_NIFI_COUNTER"
value: "true"
After enabling it, you can view the report while the test is running, or after the Ingest process is completed. One disadvantage is that you can only see one report for each connector. If you are using the same connector to run another Ingest pipeline, the report that was generated for the previous run will be removed at the beginning of the new Ingest process (this process can take a couple of minutes).
After an Ingest pipeline is finished, the Ingest report, Ingest Metrics, will
be sent to the index run within Elasticsearch. You can configure
Grafana to display the report in the format you defined. The reports for the
different Ingest pipelines and different connectors are all stored. You can select
connector and runID to view the report.
The data for Ingest Metrics at Grafana is different of the Queued Items/Wait Link. The metrics will only be sent, by NiFi, to Elasticsearch after the Ingest process is finished. But Queued Items/Wait Link are using Prometheus to collect information at runtime.
For tuning purposes, you may not want to finish an Ingest pipeline before running it again, or the process can fail at any point in the Ingest process. In these cases, NiFi counters may be easier to collect reports for some of the stages in an Ingest pipeline.