
Interpreting patterns and tuning search solution
You have several options for improving overall performance. Tuning ingestion also includes learning about possible side effects and negative results.
A case of slow data transfer – multithreading
The transfer operation from NiFi to Elasticsearch is an example of a suboptimal segment that you can readily detect. This operation is usually handled by the bulk update processor, which shows up in Grafana as a rapid growth in the number of incoming documents, which then peaks, followed by a slowdown, shallow decline in the number of documents due to the transfer speed. As you can see, it looks like this:
Due to the slowdown transfer speed to Elasticsearch, you can see a shallow depletion of the documents in the queue. You can increase this speed by opening more connections to Elasticsearch and configuring more threads for the Bulk Update Processor to increase throughput.
When the total number of
threads is raised, the following graph represents what happens on the system: ![]()
When the Bulk Update Processor is configured with only three threads, the initial configuration shows a very shallow depletion of the documents. When configured with 16 threads, the ramp-down angle increases significantly, and when configured with 64 threads, it improves even more. The important distinction is that increasing the number of threads in this processor increases the number of HTTP connections opened from NiFi to Elasticsearch, while the resulting CPU utilisation remains almost unchanged.
Other processors, such as the NLP process group, could benefit from similar observation and improvement. The maximum concurrency achievable in the system is restricted by the number of physical CPU cores available to the NiFi pod while using CPU bound processors like NLP.
Side effects from thread increase
Increasing the number of processor threads is a risky modification that should be done in small increments instead of in large ones. Going from 3 to 64 threads, for example, is not recommended. Make smaller incremental changes of 16, 32, and eventually 64 threads, testing each increment and observing the results. It is observed that after 32 threads per CPU, the benefits are negligible in most cases.
Furthermore, the OS resources available to the pod/ JVM where NiFi runs should be given special consideration. A CPU-bound processor, for instance, benefits from concurrency only if there are any available cores on the CPU. Increased processor concurrency, on the other hand, increases the JVM heap size and the required native memory. To detect and correct such situations, it is critical to monitor heap values and overall memory.
Side effects of bucket size increase
Increasing bucket size greatly affects the NiFi system's resources, such as heap and, more importantly, native memory. Since the native memory is used as a buffering area when sending the data to Elasticsearch, this increase enlarges the total memory footprint of the pod.
Detecting and capturing such a failure is a rare occurrence that is often overlooked. One such event is shared here, along with point to the metrics values:
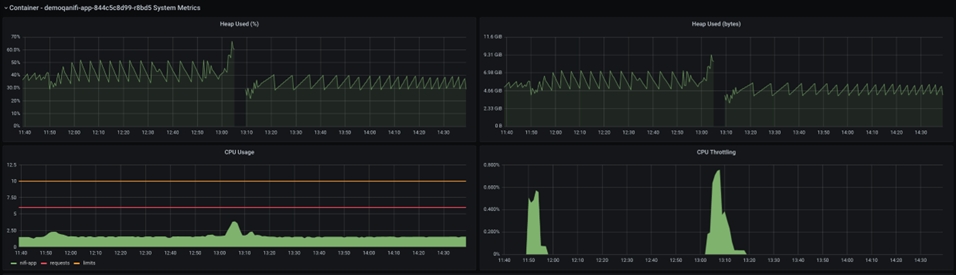
The Java heap size is seen in the graph above. The brief pause in the middle of the graph reflects the NiFi pod crashing and restarting. If you observe the CPU before the crash, you can see that the CPU utilisation spikes, but the heap size never reaches 100%, instead staying around 70%, which is a reasonable heap size.
However, the below graph shows a totally different picture:
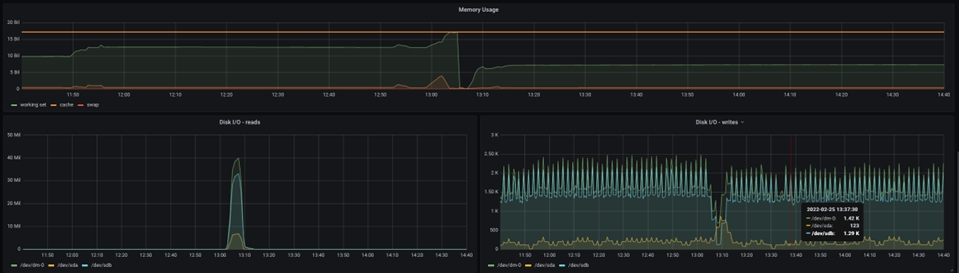
The total memory assigned to the Pod can be seen here, and you can see that the requested Memory is reaching the maximum allocated memory at the time of the NiFi JVM's crash. As a result, more Memory must be allocated to accommodate larger bucket size.
With a large bucket size, a different problem may arise: Elasticsearch may slow down the data import significantly as the flow file size increases, to a point that the benefits in NiFi are completely negated and processing degrades due to the Elasticsearch data import. Organize and track your ingest testing for different bucket size values to avoid such situations and confusing results.
A case of slow processing- scroll size tune
The slowdown delivery of data to NiFi is the third most common reason of data processing delay. This could be due to the lack of database processing power, improper tuning, or inefficient customization. While this issue is best addressed on the database side, it is sometimes much more efficient to optimise NiFi data access to minimize the impact of database overhead on ingest execution.
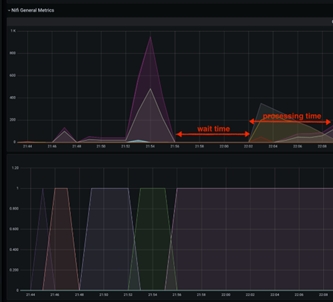
In this particular case, the slowdown are going to be visible within the Grafana graphs as idle time between the queued item’s peaks. This happens when the scroll.size parameter is configured to be relatively low compared to the total size of the database table that is being accessed. The scroll.size should ideally match the processing time, where the database query time should be equal to the NiFi processing time of the extracted data. However, in special cases where the SQL runs longer then the NiFi processing, you could observe this as short peaks in the queried items graph, spaced apart by flat/idle line.
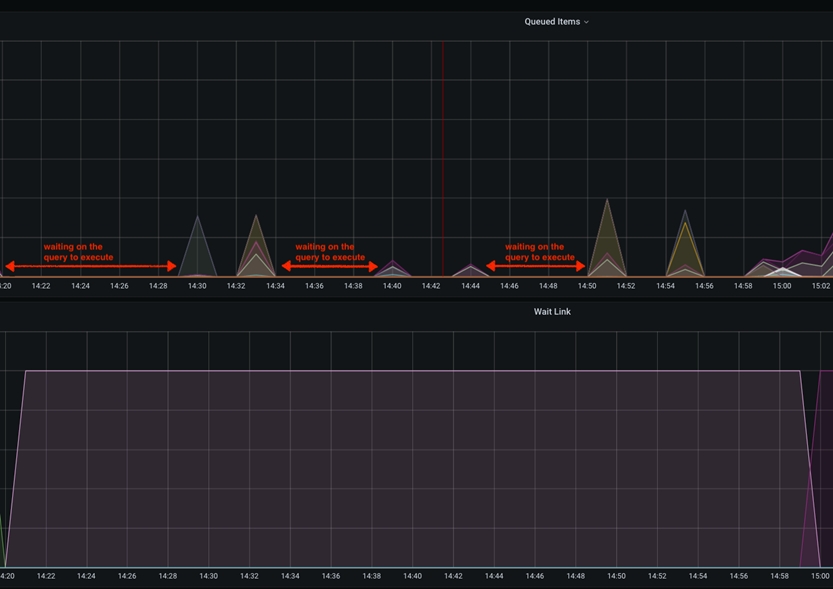
This idle time between the fetches of the database data could be mitigated by increasing the scroll.page.size value to higher number. For example if the database has total of 1 M catalog items, and the scroll.page.size is set to 100000 items, the whole process involves 10 iterations. This indicates that the items in the queue have 10 spikes, with idle time intervals. You can reduce the wait time by 50% by increasing scroll.page.size to 200000, thereby reducing the cycles to 5 cycles. You should set scroll.page.size to 1M so that the whole data can be retrieved in one cycle and only one idle period for the processing phase is observed.The following graph shows one such case:
Side effect from very large scroll sizes
Since the effect of changing the NiFi pod might be considerable, this minor adjustment should be carefully considered. Because all of the data are sent to NiFi at the same time, you will need enough of storage and RAM to keep the pod functioning smoothly. If NiFi is running out of heap, native memory, or storage space, careful monitoring and modification are needed to maintain optimal performance.
Finding the sweet spot
Overall, the strategy described should provide a monitored and measured performance testing and tuning of the NiFi/ Elasticsearch operations. While some tuning variables are more impactful on the system, you should consider all three to obtain optimal throughput of the system.
Due to the side effects, very large tuning variable changes can adversely affect total processing time. It should be noted again that careful change of the values should be monitored and measured, making sure that each individual change produces a positive change (improves) to the overall processing time.
Other considerations
- Cache
size
"[${TENANT:-}${ENVIRONMENT:-}live]:services/cache/nifi/Price":
           localCache:
             maxSize: -1
             maxSizeInHeapPercent: 8   (default 2)
           remoteCache:
             enabled: false
           remoteInvalidations:
             publish: false
             subscribe: false
        "[${TENANT:-}${ENVIRONMENT:-}auth]:services/cache/nifi/Inventory":
           localCache:
             maxSize: -1
             maxSizeInHeapPercent: 8    (default 2)
           remoteCache:
             enabled: false
           remoteInvalidations:
             publish: false
             subscribe: false
        "[${TENANT:-}${ENVIRONMENT:-}auth]:services/cache/nifi/Bulk":
           localCache:
             maxSize: -1
             maxSizeInHeapPercent: 4   (default 1)
           remoteCache:
             enabled: false
           remoteInvalidations:
             publish: false
             subscribe: false
        "[${TENANT:-}${ENVIRONMENT:-}auth]:services/cache/nifi/Wait":
           localCache:
             maxSize: -1
             maxSizeInHeapPercent: 4   (default 1)
           remoteCache:
             enabled: false