Integrating Opportunity Detect with Unica Campaign in interactive mode
The following example illustrates how you might use the Expanded Outcome data in Unica Campaign, in interactive mode.
Before you begin
You must have Unica Campaign and Opportunity Detect installed and running.
About this task
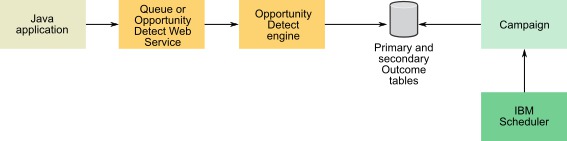
The following diagram illustrates the example described in this procedure.
Procedure
- Create the Expanded Outcome tables in your database using the script provided with Opportunity Detect.
-
Do one of the following.
- If you plan to use a queue connector, configure a queue for your transaction data in your queue server.
- If you plan to use the Web Service, develop the required Java™ classes.
-
On the Server Groups page in Opportunity Detect, do the following.
- If a database connection for the database where you created your Expanded Outcome tables does not exist, create one.
- If an Expanded Outcome data source connector does not exist, create one.
If you make the connector sharable, you can map the connector to your primary Expanded Outcome table on the Server Groups page or on the Deployment tab of the workspace. If you do not make the connector sharable, you can map it only on the Deployment tab.
- Configure the Opportunity Detect workspace to use the Web Service or a queue data source connector for transaction data, and the Expanded Outcome data source connector for Outcome data.
-
Configure your Unica Campaign
flowchart as follows.
- Use your own scheduling utility or the Unica Scheduler to schedule flowchart runs at the desired interval; for example, every minute.