
NiFi parameter tuning
The text provides formulas and suggested values for tuning parameters related to data extraction, transformation, and bulk service in a given pipeline. These parameters are calculated based on various factors and can help optimize the performance of the system. Sample tests are provided to illustrate the application of these tuning parameters.
Use the following formulas and suggested values for tuning parameters related to data extraction, transformation, and bulk service. Calculate them for each stage in the pipeline, including data extraction thread count, page size, bucket size, transformer thread count, bulk service thread count, and bulk service dataflow rate.
Parameters and formulae
Use the data extracted using the procedures described in Metrics for tuning NiFi in the following tuning parameters and their corresponding calculated formulae.
Data extraction thread count
- Formula 1
-
Data Extraction (ExecuteSQL) Thread Count (for each stage) <= Database CPU
The data extraction thread count in each stage of a pipeline should not exceed the total number of database CPUs.
- Compare the cumulative time of SQL Execution and SQL Fetch against that of the control test to determine if the new tuning setting can produce less cumulative time.
- The data extraction thread count should not be more than the total number of database CPUs.
- Start by using Formula
1 with one thread count for the
ExecuteSQLRecord processor. This is the control test. Then
employ the following formula.
- Formula 2
-
Data Extraction (ExecuteSQL) Thread Count = Thread Count + 1
- Increase the thread count and note whether the success
criteria can still be met. If so, use the current setting as the new control
test setting and repeat these tuning procedures until the success criteria
can no longer be met.Note: Each stage of a given pipeline must perform this tuning individually. It is recommended that you perform only one tuning test at a time.
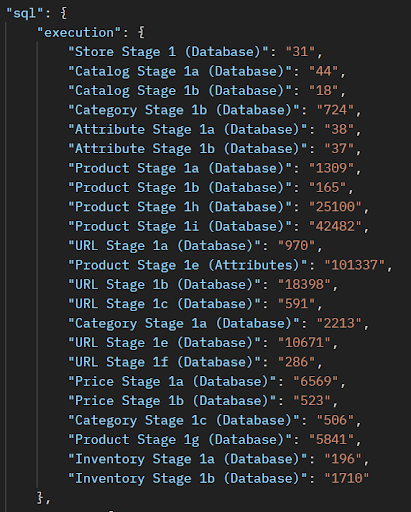
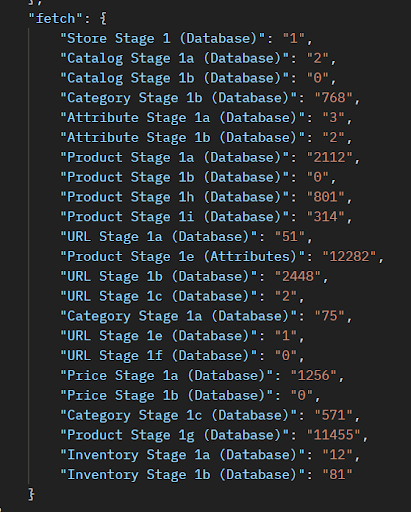
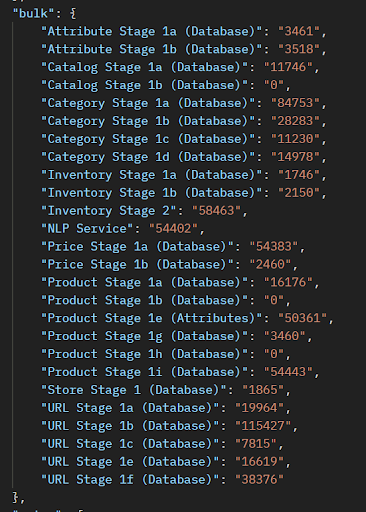
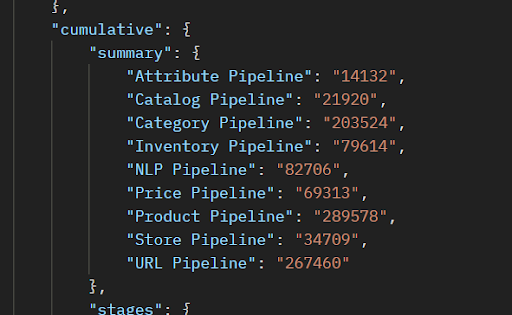
You can compare the cumulative time of SQL execution and SQL fetch in the Ingest Summary Report.

Data extraction page size
- Formula 3
-
Data Extraction Page Size (for DB2) (for each stage) <= total rows returned by the SQL statement
- Define an acceptable percentage for the cumulative time, for example 2% of that from the control test.
- Compare the Cumulative Time of SQL Execution and SQL Fetch against that of the control test to determine if the new tuning setting can produce less cumulative time, or at least not more than the acceptable range.
- Estimate the total number of entries in the result set returned by the SQL statement of the current stage and use that as the initial page size while keeping the bucket size to be at the default value in the meantime. This is the control test.
- Use Formula 3 to determine the initial page size of the current stage.
- Use the following formula,
- Formula 4
-
Data Extraction Page Size = round ( new% x Page Size )
- Next, use 50% of the control test page size and observe if the success criteria can still be met.
- If the new cumulative time is less than that of the control test, repeat this exercise again to use 50% of the current page size. Otherwise, if the new cumulative time is higher, repeat this exercise using 150% of the current page size.
- The tuning test should reach a point where the new cumulative total of SQL Execution and Fetch time is the same as that of the control test. Once this state has been reached, the current page size should be optimal.
You can compare the cumulative time of SQL execution and SQL fetch in the Ingest Summary Report.

Data extraction bucket size
- Formula 5
-
Data Extraction Bucket Size (for DB2) (for each stage) <= round ( total expected rows from SQL statement / Cumulated Total of Data sent to Elasticsearch for current stage ) x Elasticsearch maximum payload size
- Compare the cumulative bulk Ingest time against that of the control test to determine if the new setting can produce less cumulative time.
- Verify that the final bulk request size does not exceed the Elasticsearch maximum payload size, i.e. 100 MB.
- Begin by usingFormula 5 to determine the optimal bucket size of the current stage. This is the control test.
- Optional experiments can be performed by either increasing or decreasing the bucket size to observe if the success criteria can still be met.
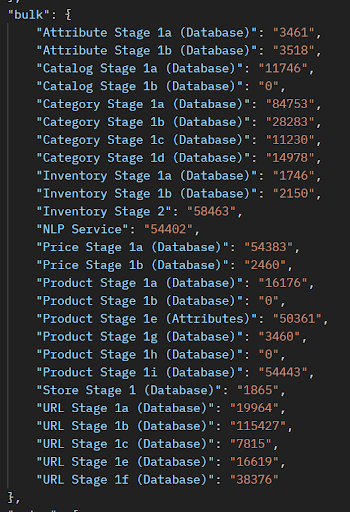
You can compare the cumulative time of bulk requests in the Ingest Summary Report.
Verify that the average flow file payload size does not exceed Elasticsearch’s maximum payload size, which defaults to 100 MB. This average can be calculated by taking the total size divided by the total flow file count obtained from the Ingest Summary report.


Transformer thread count
- Formula 6
-
Transformer Thread Count (for each stage) <= NiFi CPU
- Compare the cumulative processing time of the current stage against that of the control test to determine if the new setting can produce less cumulative time.
- Transformer thread count should not be more than the total number of NiFi CPUs.
Tuning procedures:
- Begin by using Formula 6 with one thread count for the transformation processor of the current stage. This is the control test.
- Use the following formula determine the transformer thread count.
- Formula 7
-
Transformer Thread Count = Thread Count + 1
- Increase the thread count and observe if the success criteria can still be met.
- If so, make the current setting as the new control test and repeat this set
of tuning procedures again until the success criteria are can no longer be
not met. Note: Each stage of a given pipeline must perform this tuning individually and it is recommended to perform only one tuning test at a time.
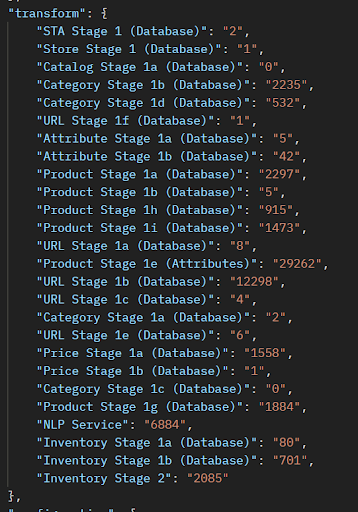
You can compare the cumulative processing time in the Ingest Summary report.
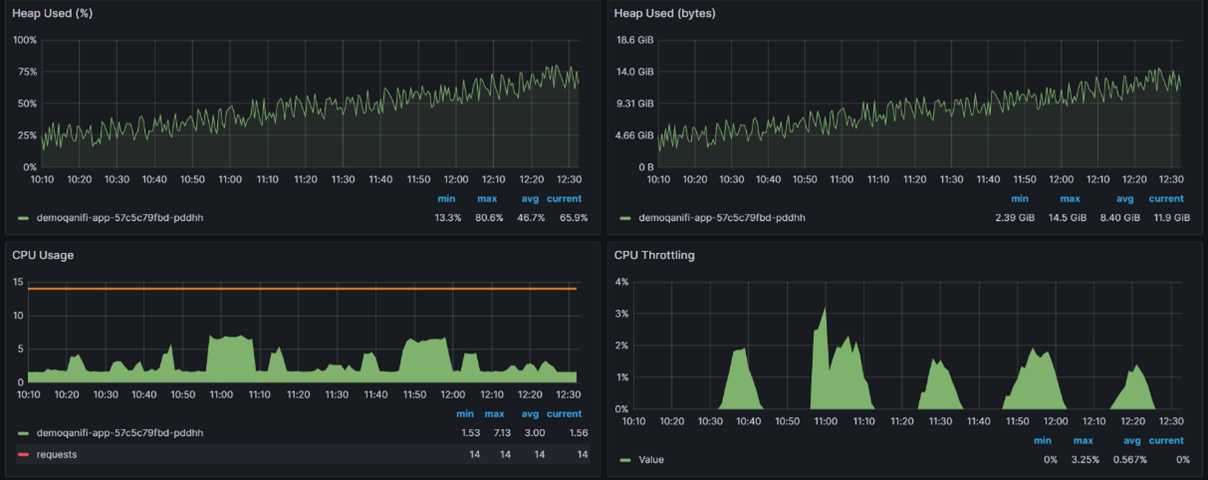
You can also verify NiFi CPU and heap memory usage using the Grafana NiFi dashboard.
Bulk service thread count
- Formula 8
-
Bulk Service Thread Count (for each index) = Elasticsearch CPU
Success criteria can be verified as follows:
- Compare the cumulative bulk Ingest time against that of the control test to determine if they are within the acceptable range.
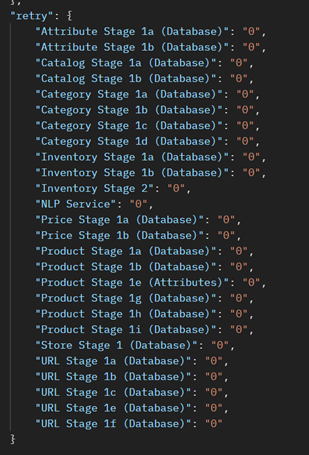
- Compare the cumulative retry count and time against that of the control test to determine if the new setting can produce less cumulative time.
- Compare the cumulative retry count and time against that of the control test to determine if the new tuning setting can produce less retry count and time. Having retries is an indication that a bottleneck is found somewhere in Elasticsearch.
- The bulk service thread count should not be more than the total number of Elasticsearch CPUs.
- Verify that the Elasticsearch CPU is normal and there is no high CPU throttling.
- Verify that Elasticsearch heap memory usage is normal.
Tuning procedures:
- Begin by using Formula 8 with one thread count for the InvokeHttp processor of the current Bulk Service. This is the control test.
- Use the following formula to calculate the bulk service thread count:
- Formula 9
-
Bulk Service Thread Count = Thread Count + 1
- Increase the thread count and observe if the success criteria can still be met.
- If so, make the current setting as the new control test and repeat this set of tuning procedures again until the success criteria are can no longer be not met.
- Although Bulk Service is shared by all stages in a pipeline, the Cumulative Bulk Service ingest time for each stage can still be used to determine if there is a potential bottleneck somewhere in one of the stages.
For example, when ingesting a catalog of 200K items in five languages, using a cluster with fourteen Elasticsearch CPUs, testing reveals that when you change Bulk Product from eight count up to twelve, the total ingest time is reduced by 27%, from 2:15 hours to 1:38 hours.
You can compare the cumulative bulk ingest time in the Ingest Summary report.
You can also use the report to ensure that the cumulative retry count is kept low.
You can use the Grafana Elasticsearch dashboard to verify Elasticsearch CPU use and heap memory usage. You can also use it to monitor indexing time.
Bulk service dataflow rate
- Formula 10
-
Maximum rate <= round ( change rate time duration / average ES bulk ingest time ) x Elasticsearch maximum payload x bulk service thread count
- Rate Control Criteria
- This is equal to your data transfer rate.
- Time Duration
- Set this number to one minute.
- Compare the cumulative bulk ingest time against that of the control test to determine if the new setting can produce a lower cumulative time.
- Compare the cumulative retry count and time against that of the control test to determine if thethe new setting can reduce retry count and time.
- Monitor NiFi queue in front of the InvokeHttp processor into Elasticsearch to ensure the backlog is always kept at a low level.
- Verify that Elasticsearch CPU is normal and there is no high CPU throttling.
- Verify that Elasticsearch heap memory usage is normal.
Tuning procedures:
- Begin by using Formula 10 to determine the optimum data flow rate for the current bulk service. This is the control test.
- Optional experiments can be performed by increasing or decreasing the maximum data rate and observing if the success criteria can still be met.
In this hypothetical case, the Product bulk average ingest time of 12 sec should have Maximum Rate set to no more than 6 GB per minute.
You can compare the cumulative bulk service data flow rate in the Ingest Summary report.
You can also verify that the cumulative retry count is kept at a low level.
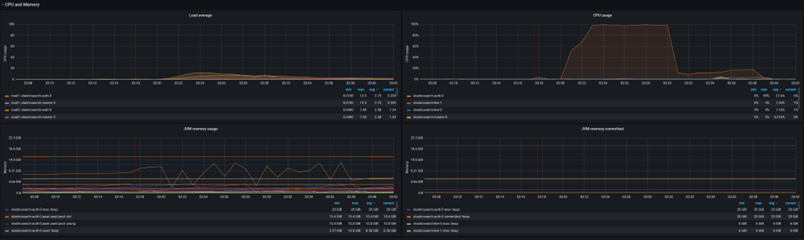
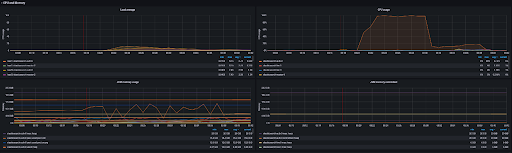
Elasticsearch CPU utilization and heap memory usage from the Grafana Elasticsearch Dashboard:
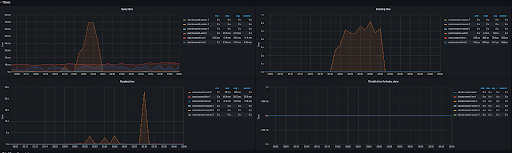
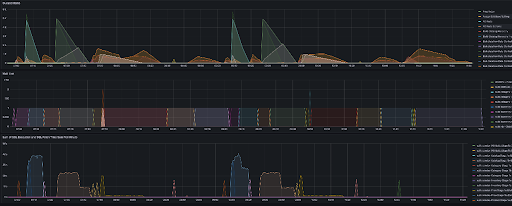
Observing Elasticsearch indexing time from the Grafana Elasticsearch Dashboard:

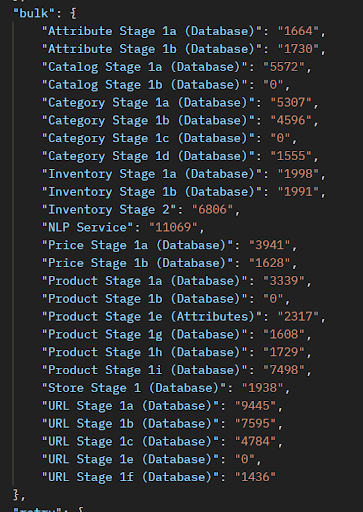
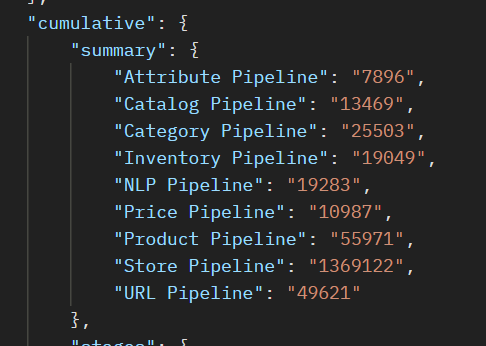
Observing the queue size in the bulk service from the Grafana NiFi Dashboard:
Analyzing your results
When testing tuning parameters, it is important to compare various metrics with previous runs and adjust scaling factors accordingly. Resource utilization should be monitored, and thread counts for each stage should be set appropriately. Re-calibration should be done after each successful run.
There are numerous things to observe and analyze while testing the tuning parameters. For each stage,
- Compare the total elapsed time with previous runs to determined whether this run was faster or slower.
- Compare the total SQL execution and fetch time with previous runs to determine whether they are longer or shorter.
- Compare the total amount of data processed and the average payload size to see whether they are the same, more or less.
- Compare resource use with previous runs to see whether it is higher or lower
than previous runs. Resources to check include:
-
- NiFi CPU, which provides a measure of the system's capacity for transforming data.
- NiFi Heap, which relates to GC and the availability of caching.
- Elasticsearch CPU and queue size, to measure the system's capacity for (concurrent) indexing.
- Database CPU to determine the capacity for (concurrent) JDBC.
-
- After measuring these values for each stage, re-adjust the scaling factor of the
corresponding formula and run the stage again.
- Thread count for extracting should be at most number of database CPU.
- Thread count for transformation should be at most twice of a.
- Thread count for loading should be at most Elasticsearch CPU.
- Control Rate for loading.