Overview Page
The WebUI Overview provides a summary of your environment. Its interactive charts and rich set of links make it easy to move quickly to areas that require immediate attention.
In WebUI, the Overview page is the default landing page. Users can navigate to the overview page from any WebUI screen by clicking the BigFix logo on the navigation bar. Links throughout the pages provide shortcuts between views.
- Refresh the screen to see the latest data.
- Click the dynamic links to address ongoing changes in your environment
- Click the charts and tallies to drill in for more details
- Mouse over graphic elements to display underlying values
- Filter new releases and popular content by type
Operator permissions and site and role assignments govern which page and data elements are displayed on the WebUI pages. For example, an operator who does not have access to the Software Distribution component cannot see the Add Software button on the Overview.
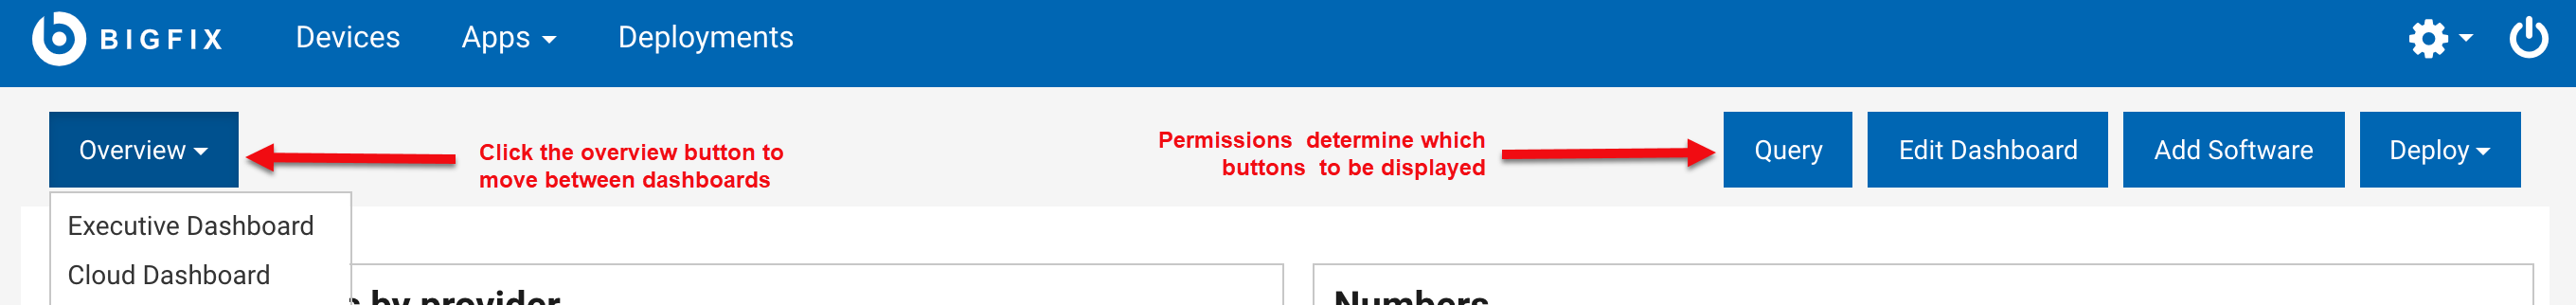
- Overview: Switch between dashboards by selecting the option under
overview dropdown list.
- Executive Dashboard: The Executive Dashboard provides information of particular interest to IT Officers, Security Officers, and Analysts. To view the Executive Dashboard, click the Overview button beneath the navigation bar and select Executive Dashboard. Use the Overview button to move between dashboards. For more information about the Executive Dashboard and its tiles, see the WebUI Administration Guide.
- Cloud Dashboard:
After installing the cloud plugins and discovering the cloud resources, you can see the summary of your cloud devices in WebUI Overview under Cloud Dashboard. To view the Cloud Dashboard, click the Overview button beneath the navigation bar and select Cloud Dashboard. This dashboard contains tiles for monitoring the amount of cloud resources in your environment, with or without an agent installed, and their distribution by type and region. Click any bar chart to open the Devices page, which lists that subset of resources, where the filters BigFix Agent Status and Managed by are pre-selected.
- Query: Click this button to open the Query editor.
- Edit Dashboard: Only Master Operators can edit the active dashboard to customize. For more information, see Permissions and Their Effects.
- Add Software: Click this button to quickly upload software packages.
- Deploy: Select an option to under this dropdown to deploy custom content, patch, profile or software.
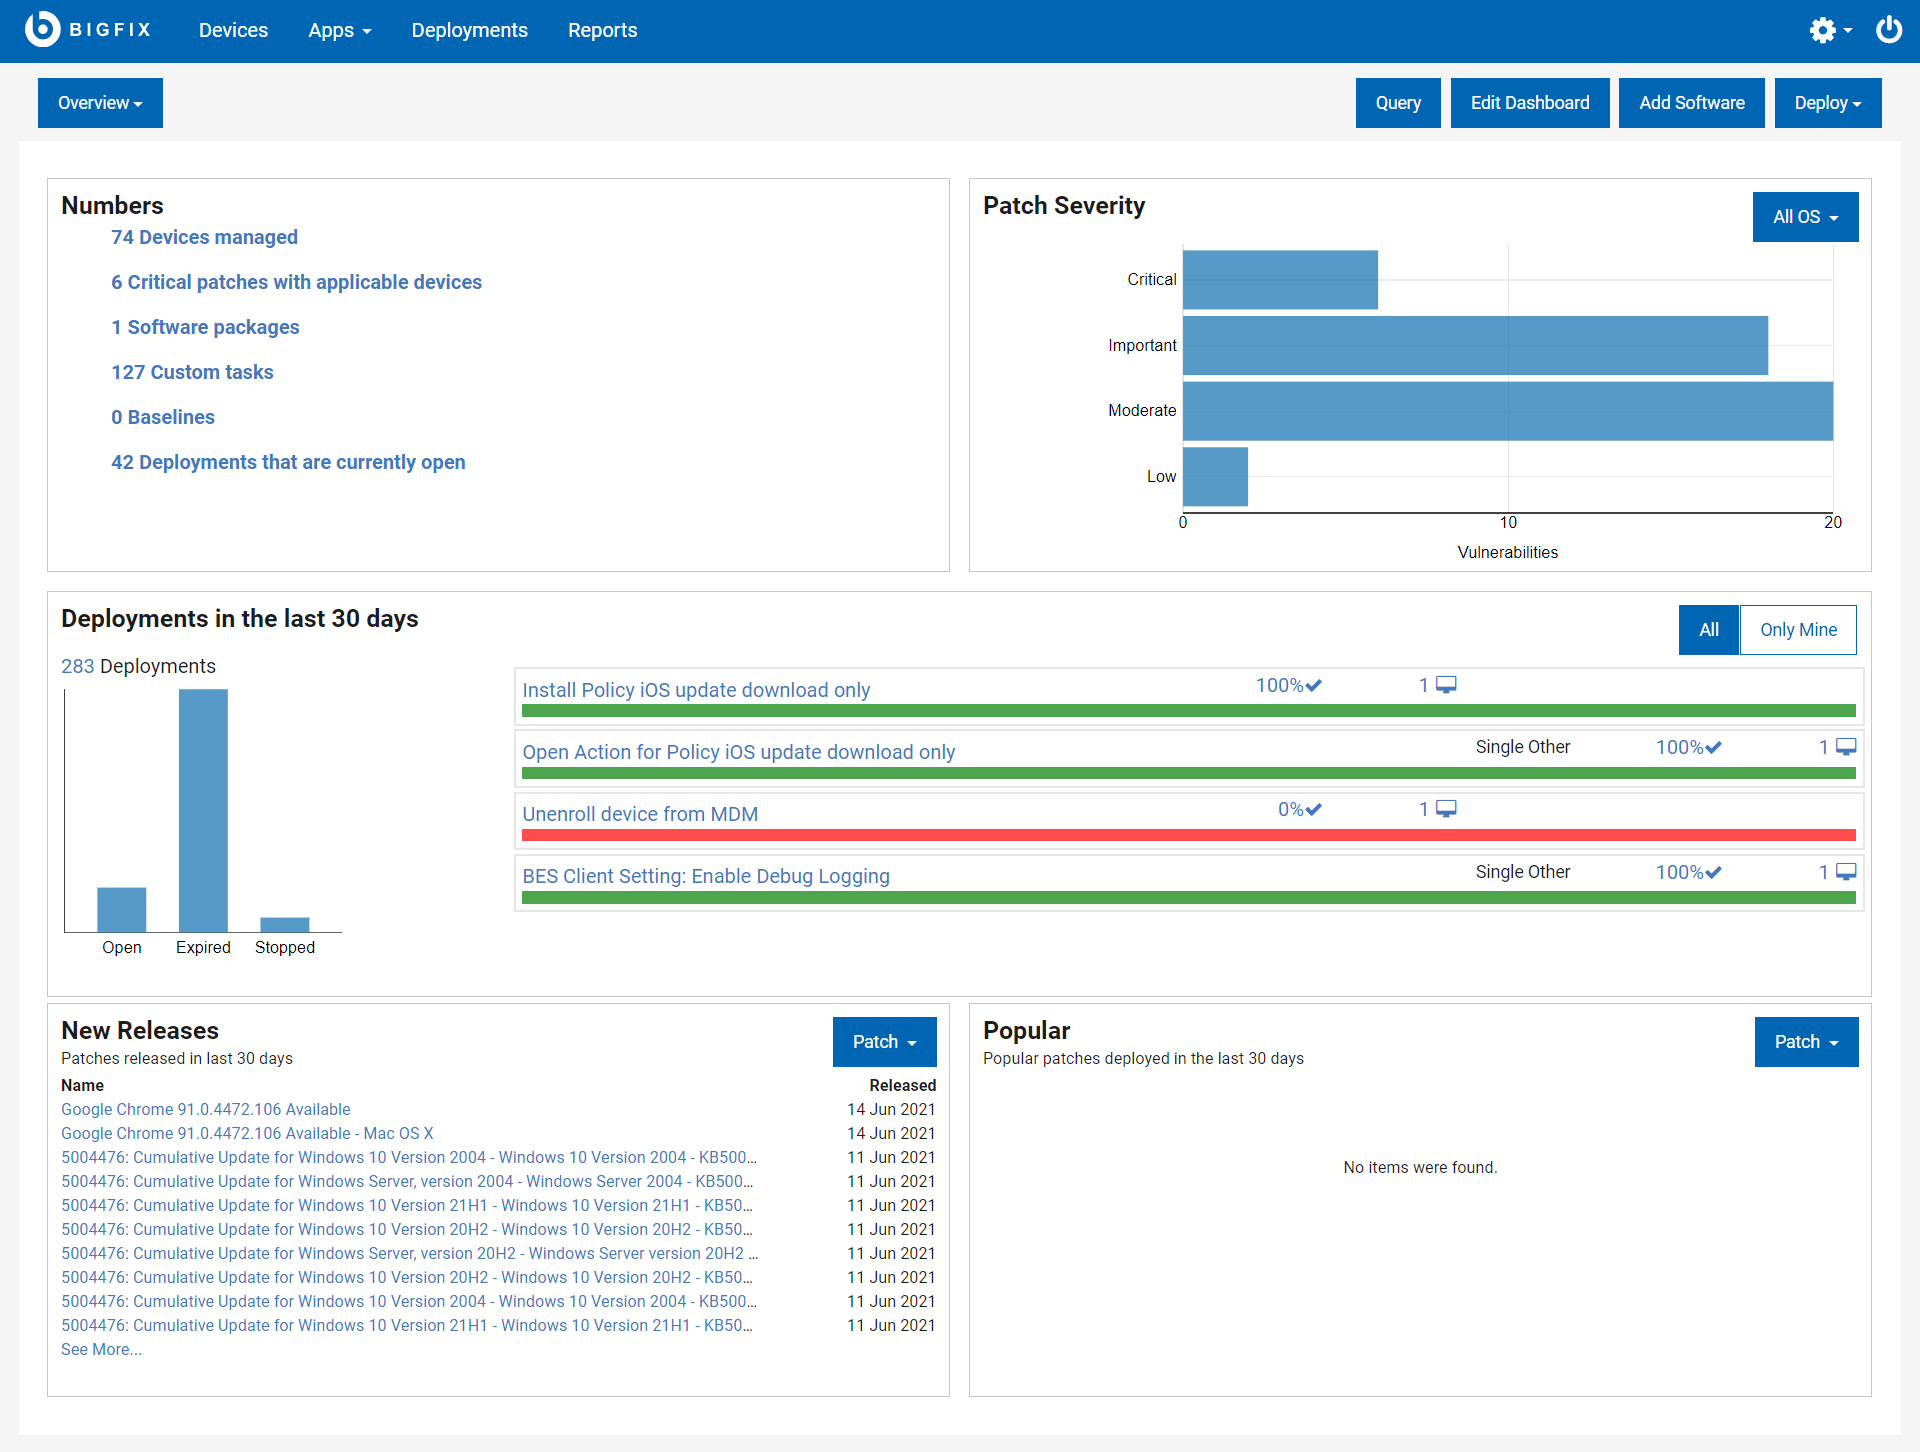
- Numbers: Displays important statistics about your environment. Click on a link to display the filtered list of that specific item.
- Patch Severity: Displays the number of patches available for all the operating systems based on the vulnerability, by default. To display data from a specific operating system, select the option from the dropdown. To display the filtered list of patches of a specific type, click on the respective blue bar.
- Deployments in the last 30 days: Displays the overview of all the deployments in your environment. Click on the available links to display the details of that item. To display only the overview of your deployments, click Only Mine.
- New Releases: Displays the latest 10 new patch releases, by default. You can also display the newly released software or custom content for your environment by selecting the option from the dropdown. Click See More… to display the complete list of items.
- Popular: Displays popular patches deployed in the last 30 days, by default. You can also display the popular software and custom content deployed in the last 30 days by selecting the option from the dropdown.
WebUI sessions close automatically after a period of inactivity. If your session expires, you will be returned to the page that you were on the next time you log in.