Using the Deployment Status Dashboard
The Deployment Status Dashboard provides a quick view of the system and brokers health status.
To access the dashboard, from the Remote Control Server web interface menu select .
By default, the Dashboard shows Server Memory status and Managed Targets status.
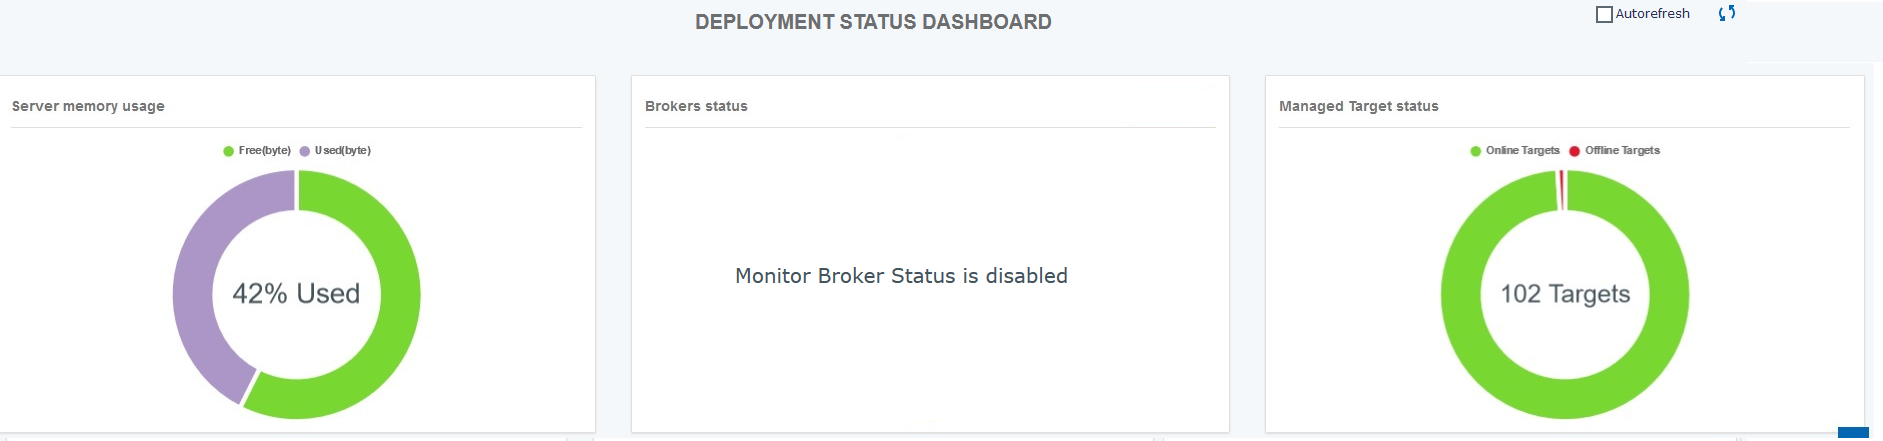
Broker Status Monitor
- Online: The broker has contacted the server in the last
rc.dashboard.broker.heartbeat.minutes. - Offline : The broker has not contacted the server in the last
rc.dashboard.broker.heartbeat.minutes. - Unknown: The broker has not yet contacted the server after a server restart.
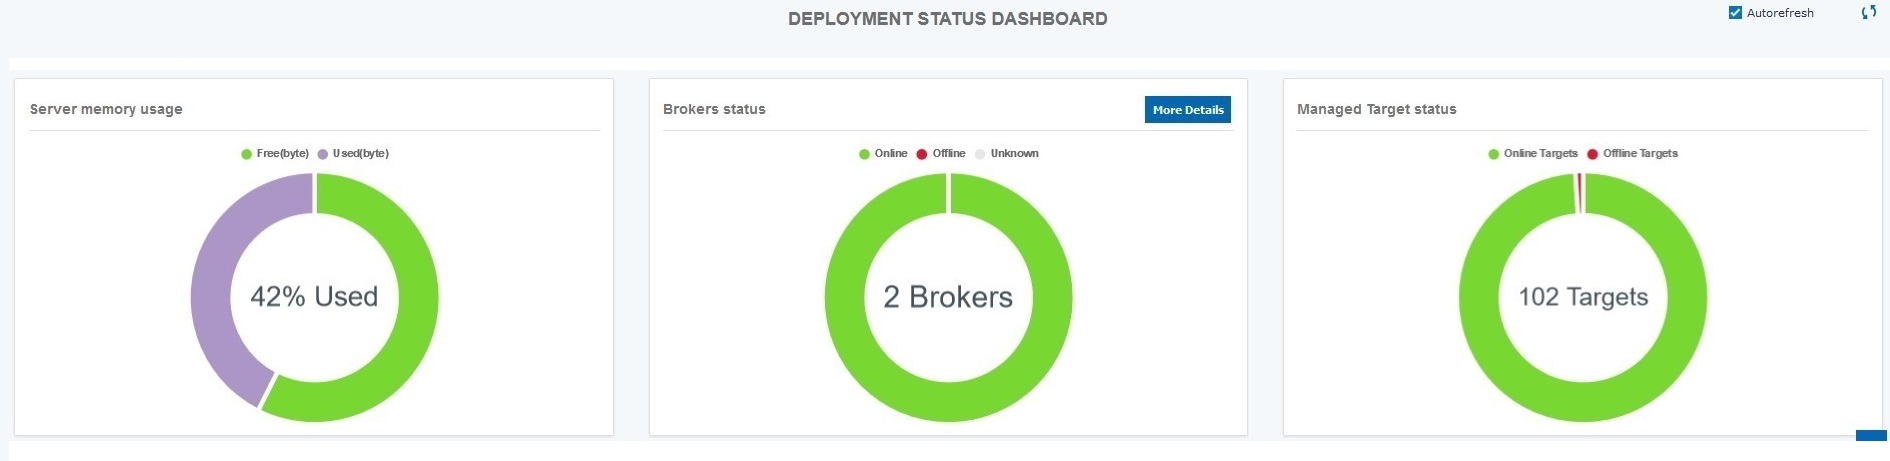
- Activate the Broker Status Monitor
- To activate the Broker Status Monitor component on the Deployment Status
Dashboard on the Remote Control Server:
- From the Remote Control Server web interface menu, select and then select trc.properies.
- At the bottom of the page, in the Status Dashboard - Configure the Broker Status Monitor section, set the property rc.dashboard.show.broker.status to True.
- At the top of the page, click Submit.
- From the Remote Control Server web interface menu, select .
- Update the Brokers configuration
-
- For Brokers of version higher than 10.0.0.0514, restart the broker.
- For Brokers of earlier version:
- Update the trc_broker.properties file
of each broker by adding the following
line:
where number_of_minutes is the value that was set inHeartBeatTimeout = number_of_minutesrc.dashboard.broker.heartbeat.minutes. - Restart the broker.
- Update the trc_broker.properties file
of each broker by adding the following
line:
Broker Status Control
The Broker Status Control component shows the status of the broker as known to the server.
The status of the broker is determined from the fact that the brokers contact the
server at rc.dashboard.broker.heartbeat.minutes intervals. If the
server does not receive a contact from the broker after the defined interval, it
flags the broker status as Offline.
On Demand Target Activity Monitor
- Activating the On Demand Target Activity Monitor
- To activate On Demand Target Activity Monitor on the Remote Control
Server:
- From the Remote Control Server web interface menu, select .
- At the bottom of the page, in the Status Dashboard - Include OnDemand Activity in Broker Trend section, set the property rc.dashboard.show.ondemand.trend to True.
- At the top of the page, click Submit.
- From the web interface menu, select .
Important: If the On Demand Target Activity Monitor is used along with other dashboard features, you need to configurerc.dashboard.broker.mappingto avoid brokers duplication on the dashboard page. This property defines a mapping between the broker IP address as seen by the server and the hostname of the broker. For example: “10.14.75.67,eolo;10.14.75.62,harlock”. Refer to the property description in the edit trc.property web page for more information on how to configure the parameter.
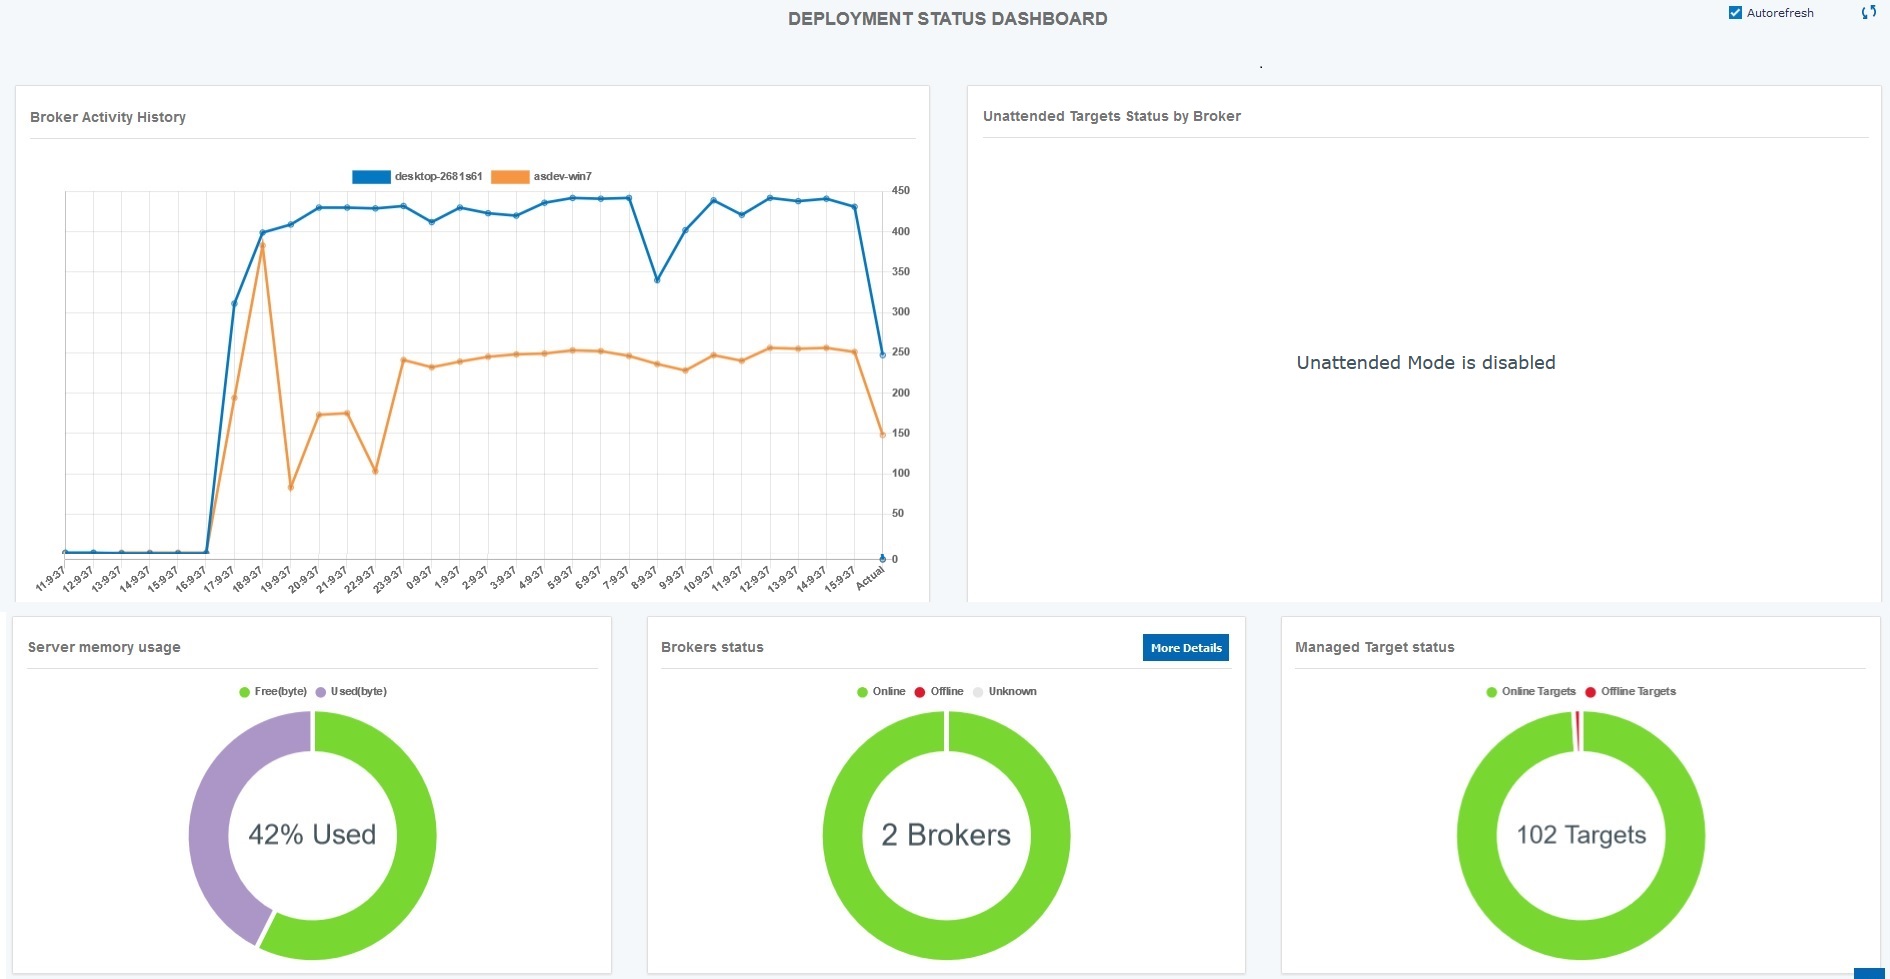
- Broker Activity History Control
-
- When the Unattended Target support is not activated, this control shows how many OnDemand sessions are established by each broker in the given time interval. The default time interval is 60 minutes.
- When the Unattended Target support is activated, the OnDemand session counts are added to the incoming heartbeats (only if OnDemand Target Activity Monitor has been activated).
Unattended Target Activity Monitor
When the Unattended Target support is activated, the dashboard shows the real-time status of the broker activity trend related to this type of target over time and the status of the reporting targets by broker.
- The Broker Activity History Control
-
This control shows how many heartbeats are received by each broker in the given time interval.
The time interval corresponds to the value of the rc.unattended.heartbeat.interval.minutes property.
- The Unattended Target Status Control
- This control shows the real time status of Unattended targets.
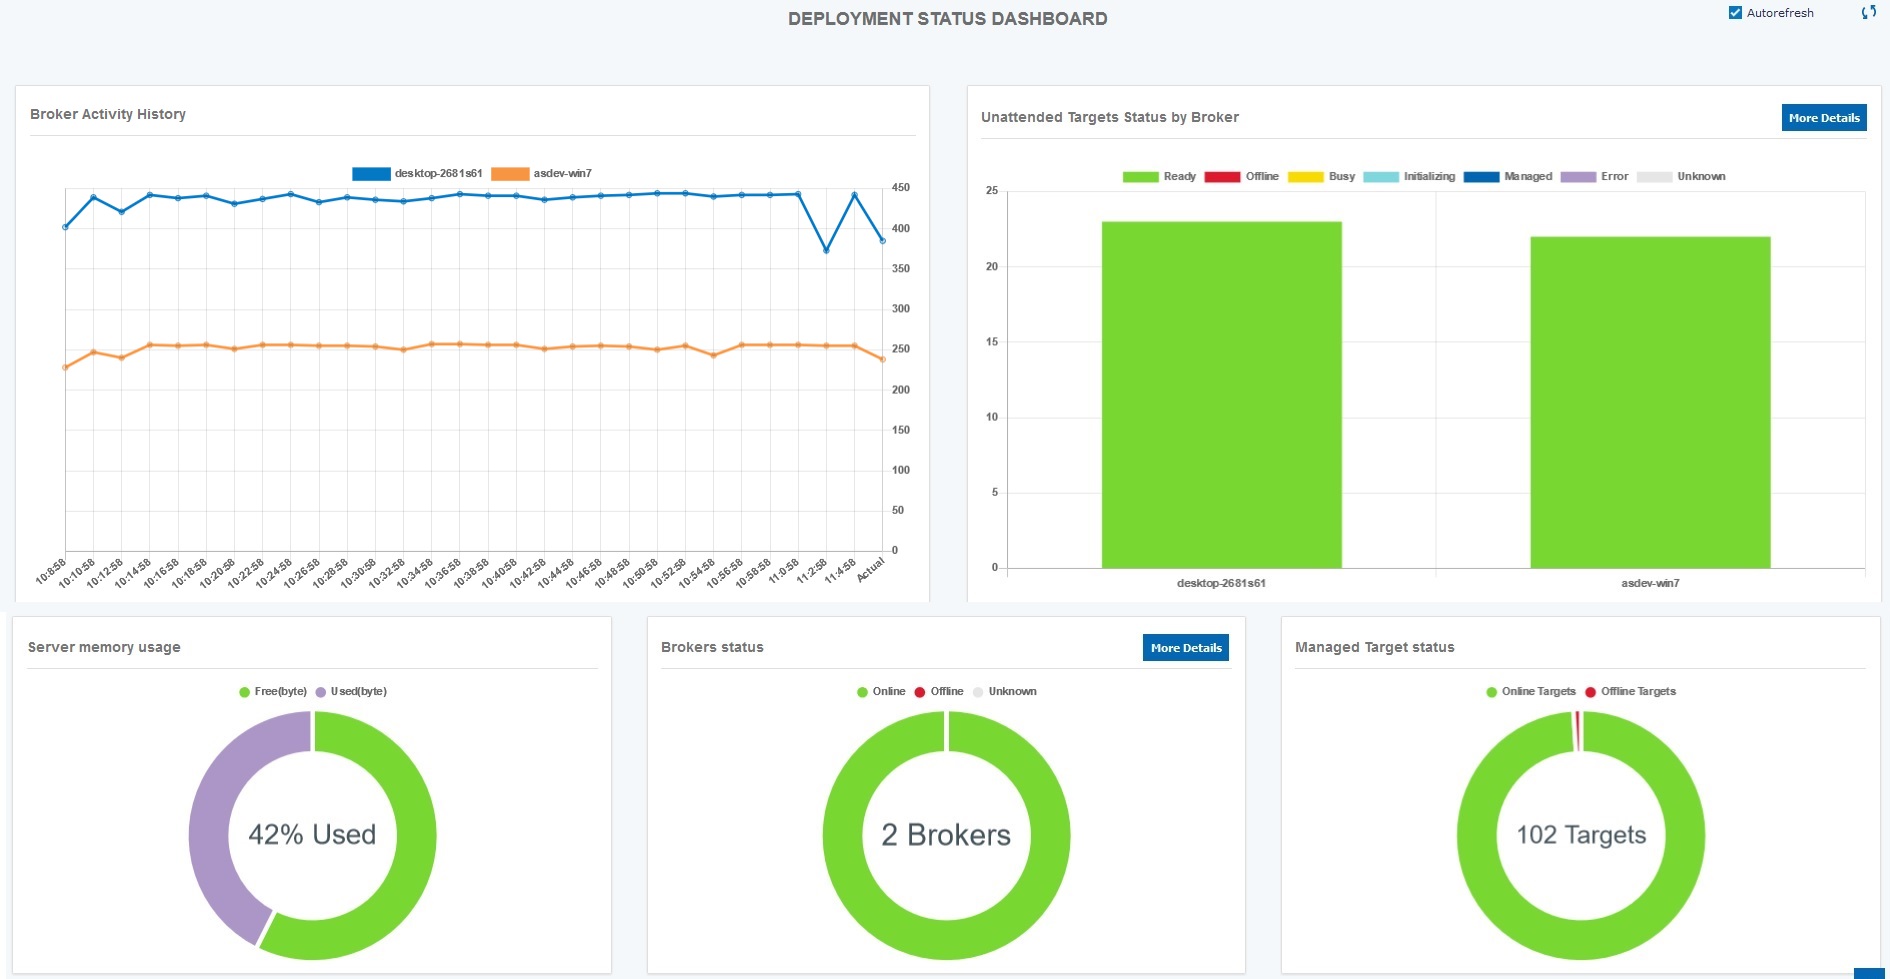 The status
can be:
The status
can be:-
- Ready The target is ready.
- Offline The target is offline.
- Initiating The target is about to start a Remote Control Session.
- Busy The target is in a Remote Control Session.
- Managed The target once registered as Unattended has reverted to Managed.
- Unknown The target that has not contacted the Server after a Server restart.
- Error The target is in error status.
You can get a list of targets in Offline, Busy, Unknown and Error status by clicking on the More Details button on the control.
You can also exclude specific target status from the view by clicking the corresponding status icon on the control legend. -
Application Errors Monitor
The Application Errors Monitor component allows to monitor error conditions on the Remote Control Server Application.
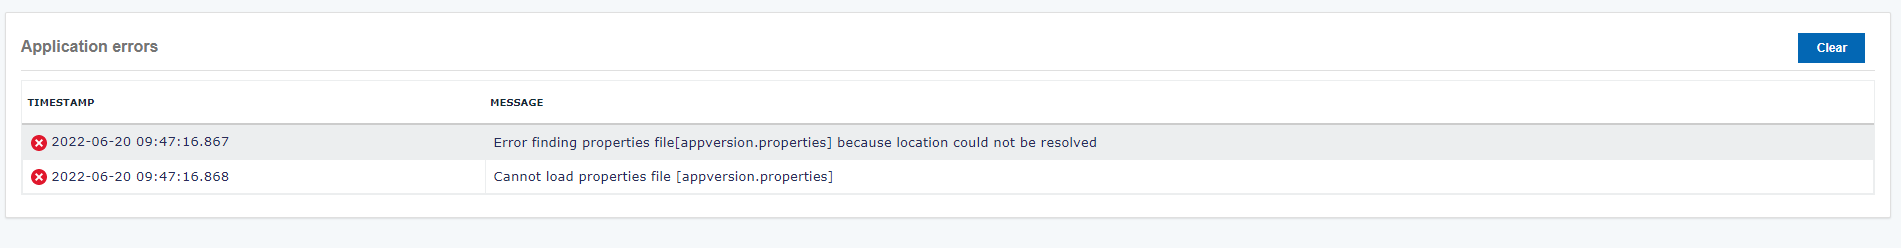
The table shows the last 100 errors that occurred on the server application in chronological order. You can clear the data in the table by clicking the "Clear" button at the top right corner of the box.
Additional Dashboard Controls
The following additional options can be used to control the Dashboard behavior.
You can specify these options from the “Status Dashboard - Tuning options” section of the trc.property file.- Dashboard Preload at System Start Up
- The dashboard operates on real time data. After the server is restarted, the Unattended Target Status Control and the Broker Status Control are empty and updated as real time data start to flow into the server. This is the default behavior.
- Trend Controls Interval and Data Points
When activating Trends Control the system selects predefine values for the rc.dashboard.trend.intervals.number and the rc.dashboard.trend.intervals.minutes properties. Those properties define how many data points are shown on the trend control and how many minutes a data point represents. Default Values when monitoring OnDemand Activity are as follows:
Property Value Meaning rc.dashboard.trend.intervals.number
rc.dashboard.trend.intervals.minutes
30
60
30 datapoint of 60 minutes each.
Provides a 30 hour coverage.
Default Values when monitoring Unattended Activity are as follow:
To override default values, specify the desired values in trc.properties.Property Value Meaning rc.dashboard.trend.intervals.number
rc.dashboard.trend.intervals.minutes
30
2 1
30 datapoint of 2 minutes each.
Provides 1-hour coverage.
- Refreshing the Status Dashboard view
-
You can manually refresh the Status Dashboard by clicking the refresh icon on the page title bar.
Alternatively you can click the Autorefresh checkbox for a 20 seconds automatic page update.