Logging and troubleshooting the Ingest and Query services
Approaches and systems for troubleshooting your Ingest and Query services are discussed.
Troubleshooting Ingest
In checking the Ingest service, the first thing you will do is check the data pipeline, to ensure that your data is actually being brought into Elasticsearch. Verify the connectors in the profile containers. Each stage of the service startup (as well as stopping) is logged automatically in these files. You can find the Ingest service log files in profile/logs/container/ingest.
When you run the NiFi pipelines, each pipeline logs a runId when it
runs. Rather than having to search through these logs, you can use the Ingest
Service REST API to query the service for return codes and for other runtime
information. To get the runId (as well as other runtime
information) you would use the /connectors/{connectorId}/runs
command. The runId can be used as input for further queries, for
instance if the particular pipeline has failed.
- Descriptors: GET /connectors. This information, from ZooKeeper, will show you the configuration state of all the connectors.
- Summary: GET /connectors{id}/runs
- Trace flow: GET connectors{id}runs/{id} with trace, log, summary
Troubleshooting the Query service
<DefaultThreshold>TRACE</DefaultThreshold> logback.xml includes a configuration element:
<configuration scan="true" scanPeriod="30 seconds">{}{}
allowing the trace settings to be changed dynamically. Any changes to the file will
be read every 30 seconds, avoiding the need to restart the application.
The log contains a large amount of information. Entries relevant to Query begin after the text string "Look in query cache for query request". This string precedes each query that was sent to Elasticsearch and represents the point where the query interacts with the Elasticsearch engine. Anything before this string is preprocessing information; what follow the line is postprocessing data.
Request level tracing for Query service
- Change the log levels dynamically without the need to restart the Query
service container by adding an
X-Log-Levelheader. - Trace only for the single request by adding an
X-Log-Levelheader.
In a centralized logging system, the logs from multiple containers are dumped into an Elasticsearch index. Since the index has the logs from all the containers mixed up with each other, there has to be a way to pull the relevant log records from the index. The traceId parameter has been introduved to resolve this issue. It accompanies each log record, and enables you to pull the log records relevant to the specific request.
By default, the logs in the Query service are generated at the ERROR log
level. You can now switch to any log level for a particular request by adding the
header, X-Log-Level = <log-level>.
<log-level> are, TRACE, DEBUG, INFO, WARN,
ERROR.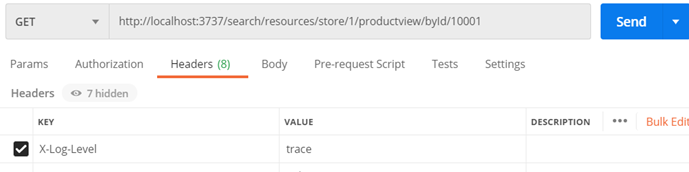
Use the Query REST API Swagger interface to access the following Query service endpoint. This endpoint enables API level tracing for the Query service.
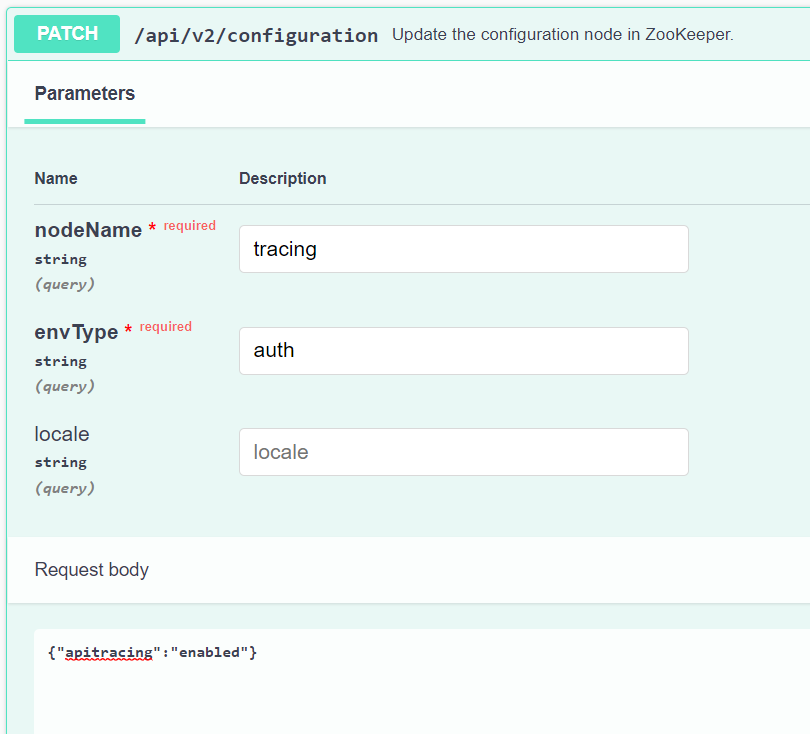 Ensure that you include the mandatory envType parameter and
{"apitracing":"enabled"} in the message
body.
You can also use the following Curl command to enable API level tracing for the Query service:
"https://query_host:query_port/search/resources/api/v2/configuration?nodeName=tracing&envType=auth" -H "accept: application/json" -H "Content-Type: application/json" -d "{\"apitracing\":\"enabled\"}"Submit a query request with the header X-Log-Level=trace using an
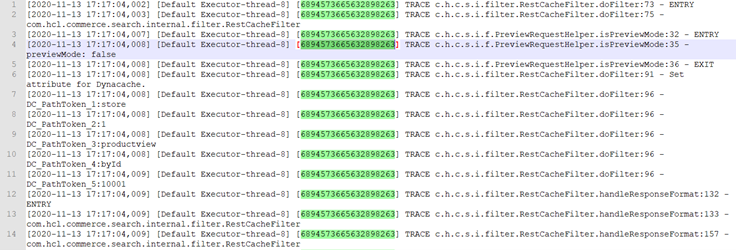
API client such as Postman. Log statements in the
trace.log having the traceIdunique to the specific request will
resemble the following.
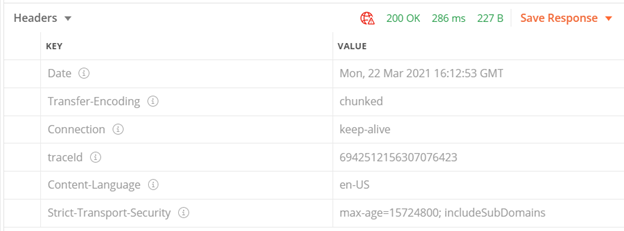
The response has a header as traceId which carries the
traceIdback to the caller.
Enabling trace on the ingest server
./opt/WebSphere/Liberty/usr/servers/default/apps/search-ingest.ear/search-ingest.war/WEB-INF/classes/log4j2-spring.xml<Loggers>
............
............
<Logger name="com.hcl" level="ALL"/>
<Root level="trace">
<AppenderRef ref="Console"></AppenderRef>
<AppenderRef ref="RollingFileAppender"></AppenderRef>
</Root>
</Loggers>After making this change you will need to restart the ingest server.