MDM debug tool
This command-line tool can be used to set log levels for individual/group/all MDM modules, execute commands and update policy settings on the MDM enrolled devices using REST APIs. This will be helpful to quickly debug production issues when there is a communication failure at different MDM layers and to trace the execution work flows, requests, responses from/to end points.
To use this tool do the following:
- Login to MDM Windows/Android containers using the command
docker exec –it <windowsmdm or androidmdm> sh - Run the command
/opt/bigfix/bin/mdmdebugcli.shto see the help information of the tool as follows: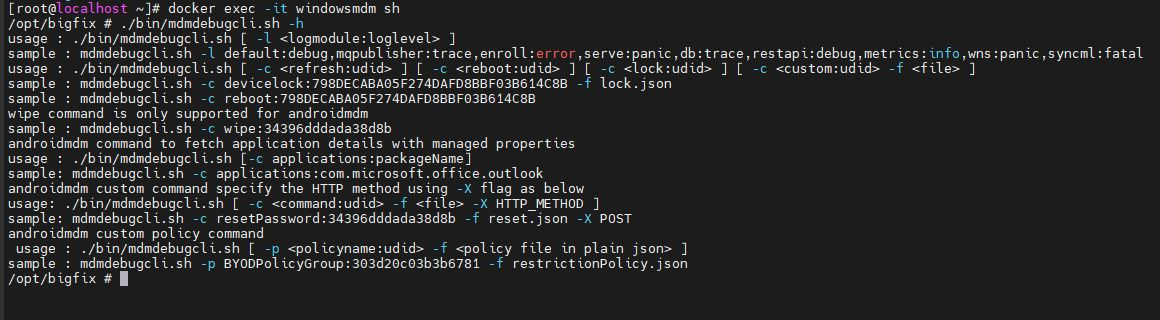 When you run a
command, it displays decoded syncml in case of Windows and decoded JSON in case
of Android.
When you run a
command, it displays decoded syncml in case of Windows and decoded JSON in case
of Android.
- Find managed configuration properties of an Android app
-
You can also use MDM debug tool to Find managed configuration properties of an Android app. To do that follow these steps:
- Login to MDM Android containers using the command
docker exec –it <androidmdm> sh - Run the command
/opt/bigfix/bin/mdmdebugcli.sh [-c
                                    applications:packageName]
where packageName is the Bundle ID of an application. For example, to find the managed configuration properties of Microsoft Outlook, enter the following command:
./opt/bigfix/bin/mdmdebugcli.sh -c applications:com.microsoft.office.outlook - Decode the response to get the list of managed configuration parameters.
- Login to MDM Android containers using the command