
Monitoring HCL Cache
HCL Cache integrates with the Prometheus and Grafana monitoring framework. The use of this integration is critical for tuning, and to ensure the correct function of the cache.
The HCL Cache-Prometheus integration provides real-time access to key monitoring metrics, such as number of operations and response times for each operation; cache-hit ratios for remote and local caches, and for each REST end-point; flow of invalidation messages; Redis memory usage; maintenance statistics, and more.
The integration includes pre-defined dashboards that are relevant to cache tuning:
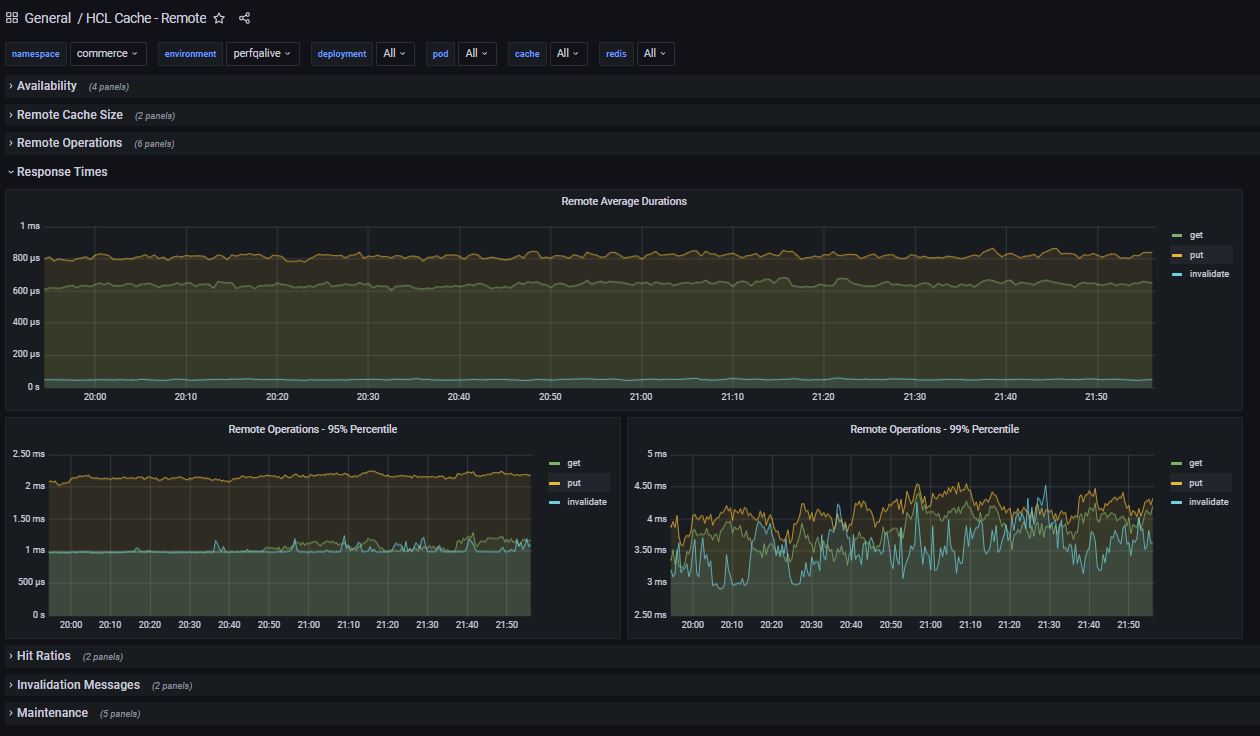
HCL Cache - Remote
Provides visibility into the remote cache including availability, cache sizes, get/ clear/
put/ invalidate operations per second, error counts, response times (averages; 95 and 99
percentiles), hit ratios, invalidations, maintenance, and more.
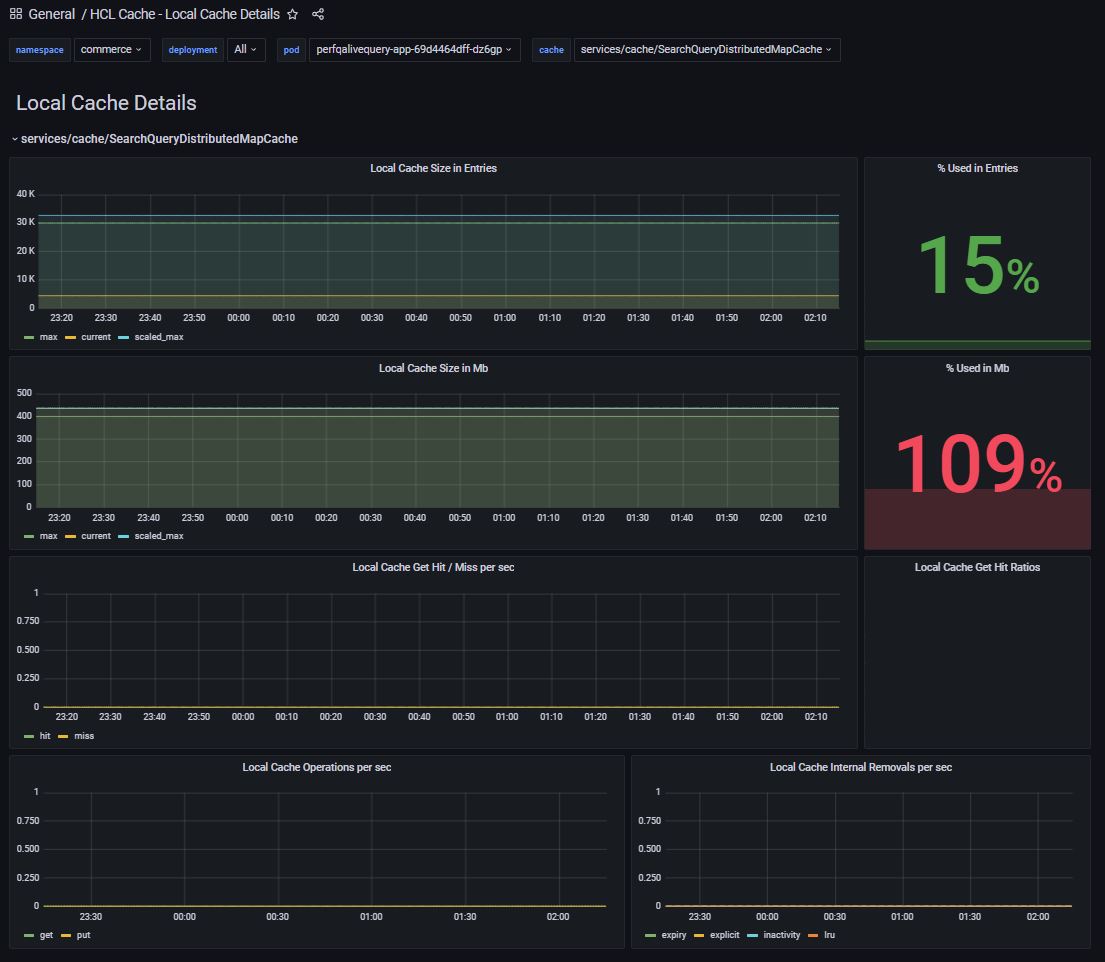
HCL Cache - local cache detail
Includes detailed information for each local cache, including sizes, operations, expiries
and evictions.
HCL Cache - local cache summary
Summary view showing caches for a pod, with sizes (number of entries and memory footprint
in megabytes).

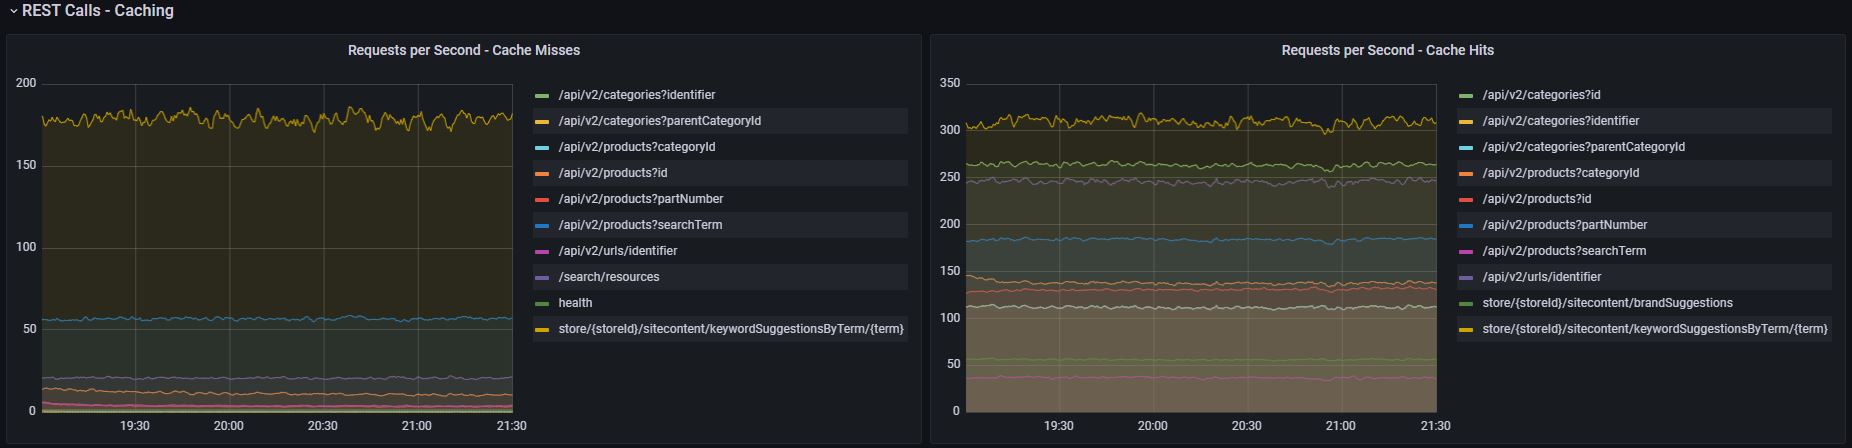
QueryApp and Transaction servers: REST caching statistics/ hit ratios
The QueryApp and Transaction Servers include cache statitics per REST service (as opposed
to per cache).
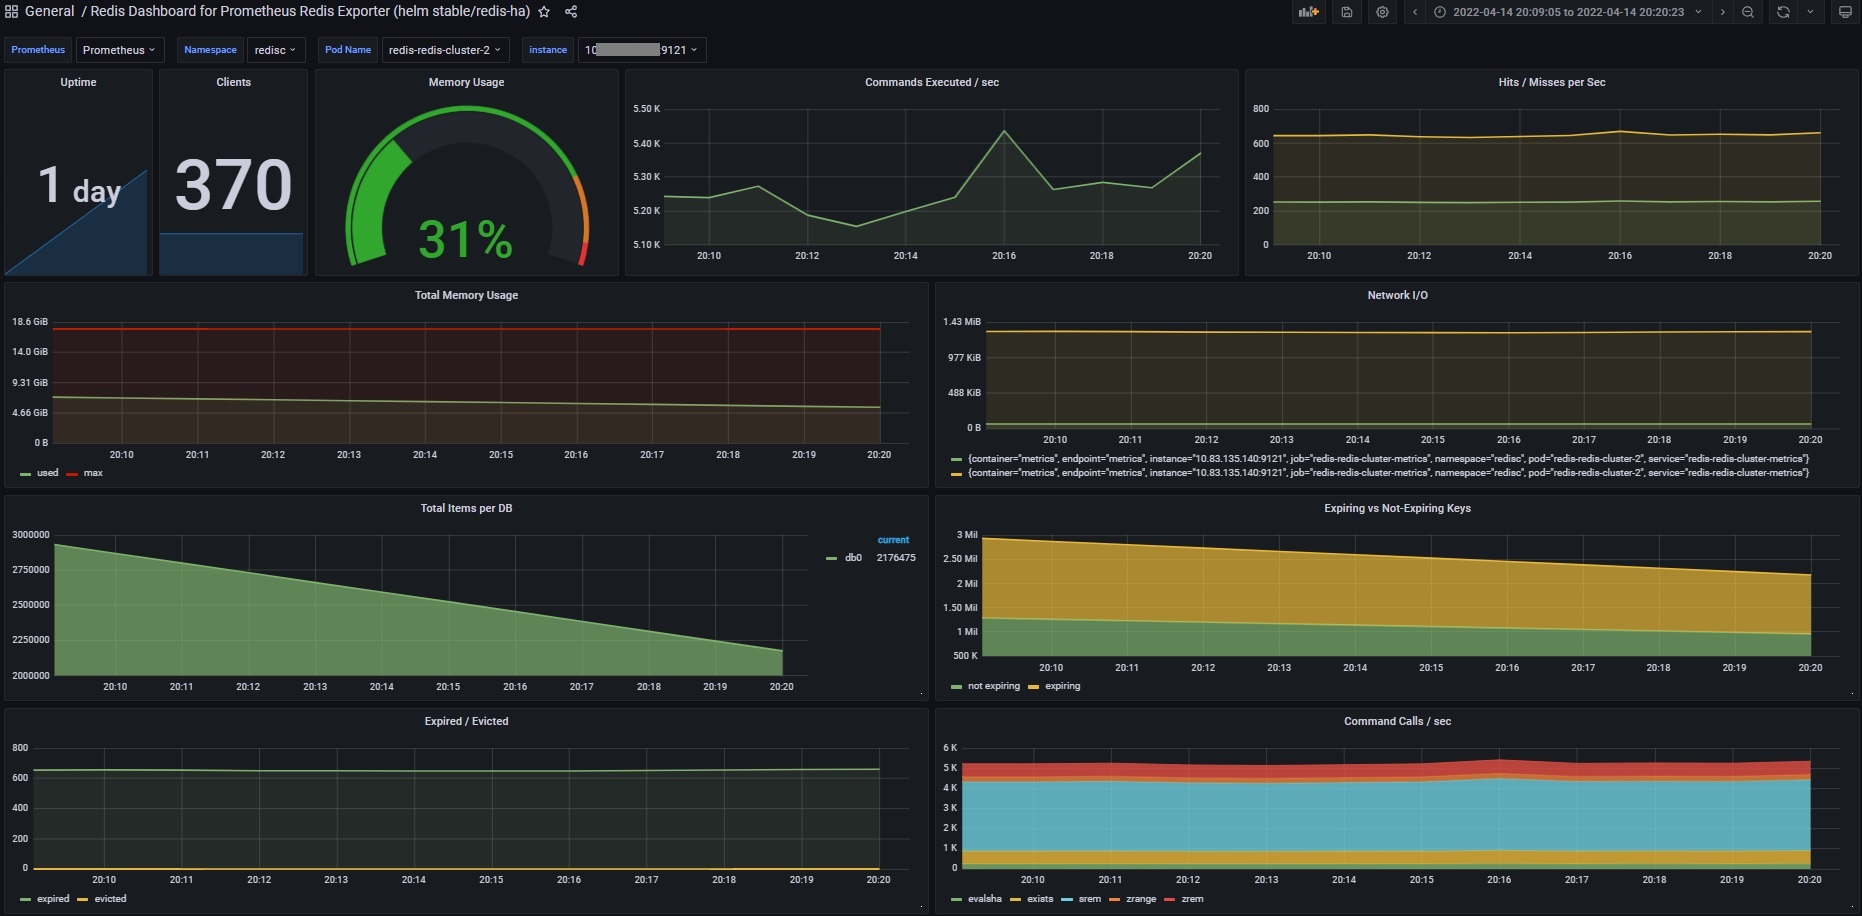
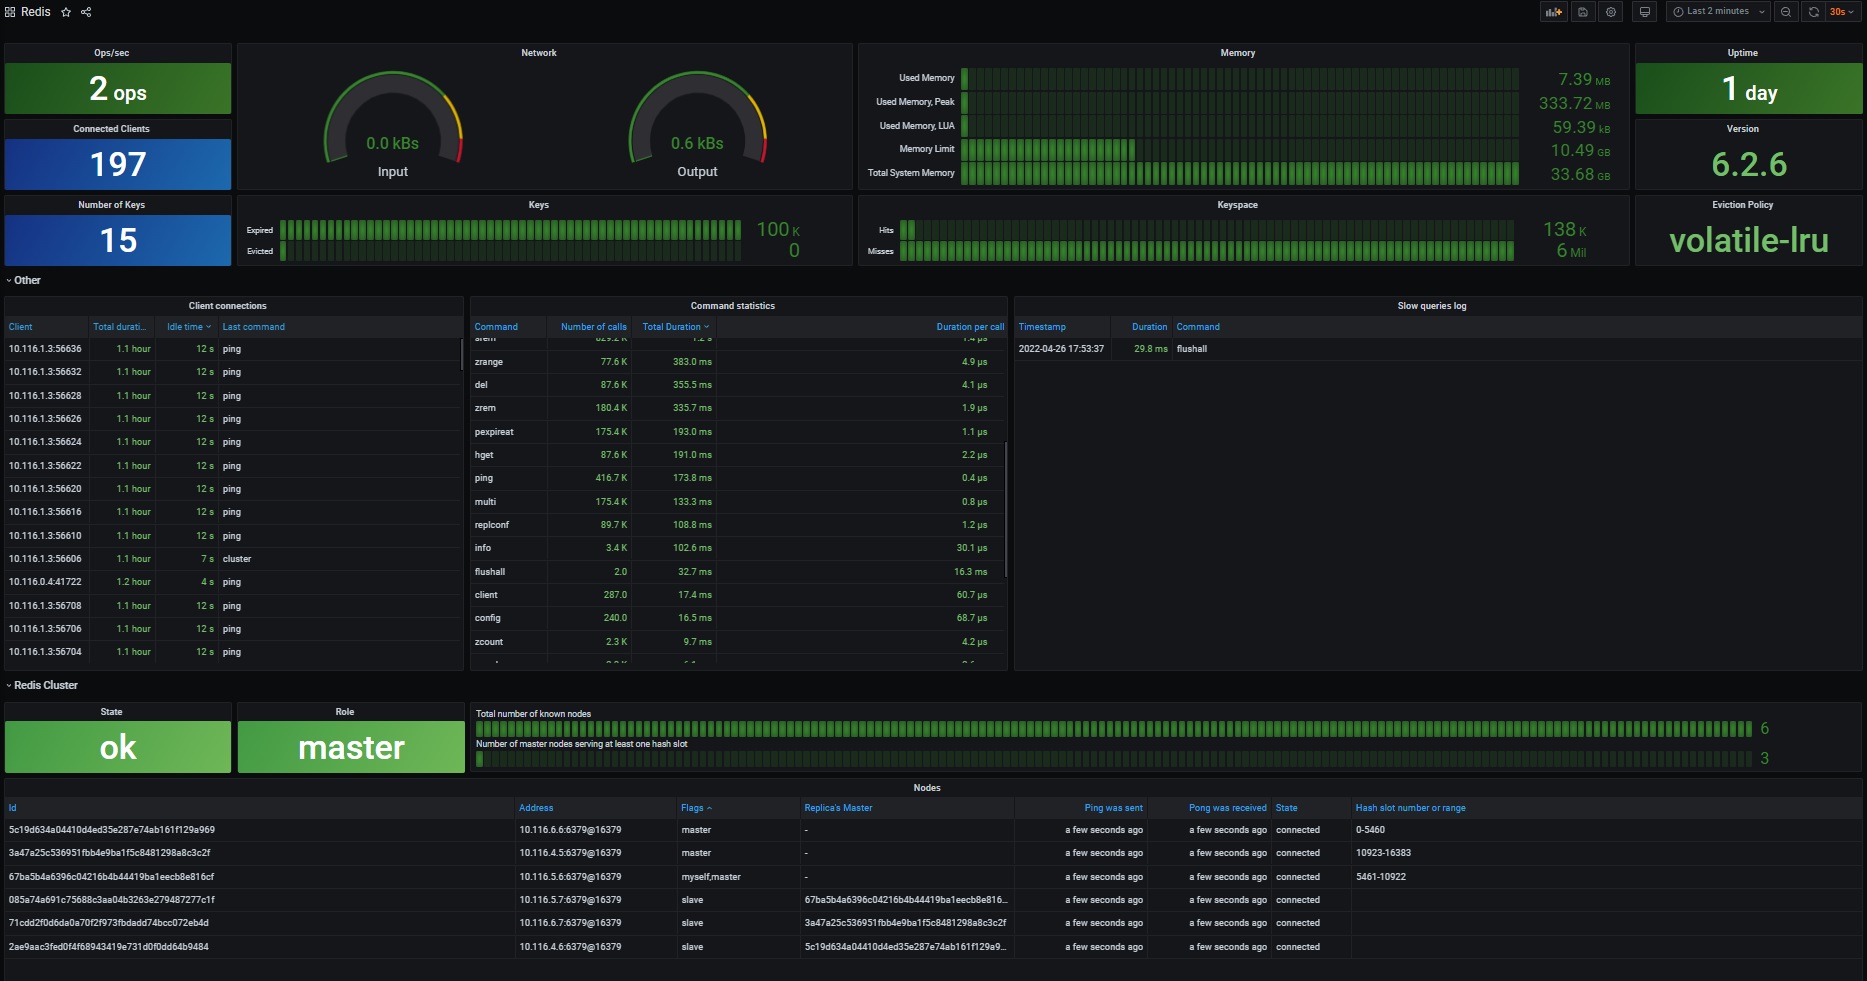
Redis
If Redis is installed with the Prometheus exporter, the available dashboard can
display information about the connected clients, memory used, commands executed, and more.
Grafana also supports a Redis datasource. The Redis
Dashboard retrieves information directly from Redis by querying the Redis
datasource. The output complements the information provided by the Redis Prometheus
exporter.
The redis-datasource can be enabled during Prometheus Operator/ Grafana installation as follows:
grafana:
plugins:
- redis-datasource