Visualization Tool
The Visualization tool allows administrators to view and manipulate data from their network. To start this tool, Select Launch Visualization Tool from the Tools menu. A dialog opens allowing you to set certain parameters:
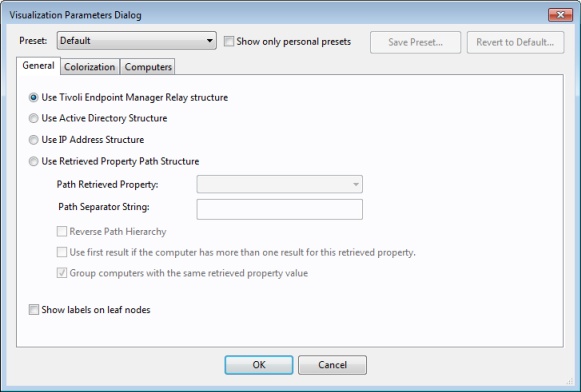
This dialog allows you to load and save your preset preferences to customize individual views of your network. The presets are managed with a simple interface:
- Preset: Select a named set of options from this pull-down menu of previously-defined preferences.
- Show only personal presets: Check this box to filter down the list of presets to just those you personally created.
- Save Preset: Click
this button to save the current set of preferences as a named preset.
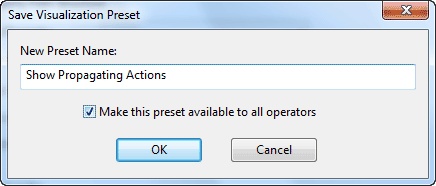
You can choose to make your presets private, or you can share them with other Operators. Later, if you want to change the parameters of this preset, open it, make the changes, and save it with the same name. You are asked to confirm the update.
- Delete Preset: Deletes the currently selected preset.
Below the Preset interface, there are three tabbed areas:
- General: Describe the network hierarchy according to the specified structure.
- Colorization: Set up a coloring scheme for the display.
- Computers: Select all computers or a specified subset.
Before running the tool, your options are checked for completeness. If they pass, the Visualization tool runs with these values.
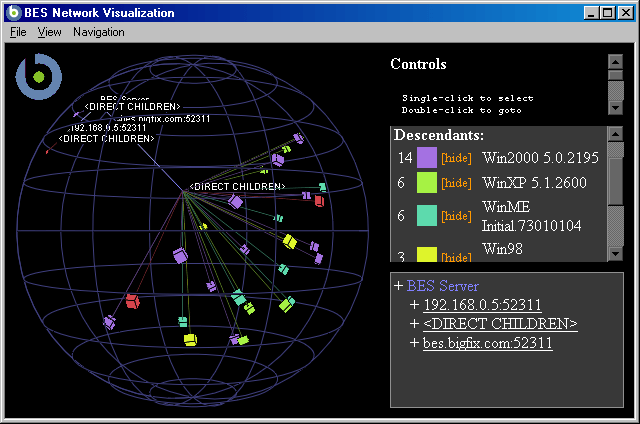
With this panel, you can display network locations, relay hierarchies, Active Directory domains, and other administrator-defined hierarchies. The tool is 3-dimensional and you can rotate the graph to better visualize the network.
The tool makes it possible to view a real-time graphical network map showing Fixlet message status, Action status, Retrieved Property information, and much more. For example, you could view all computers that are currently unpatched for a specific Fixlet across your enterprise, and watch the clients change from red to green as the patch is propagated.
This dialog is available by selecting Tools > Launch Visualization Tool. You must enable hardware acceleration and OWC, if you have not done so already.