The Device List
View a list of BigFix managed devices, create customized device reports, and review the detailed information about each device to effectively perform actions on and proactively monitor the health of the endpoints.
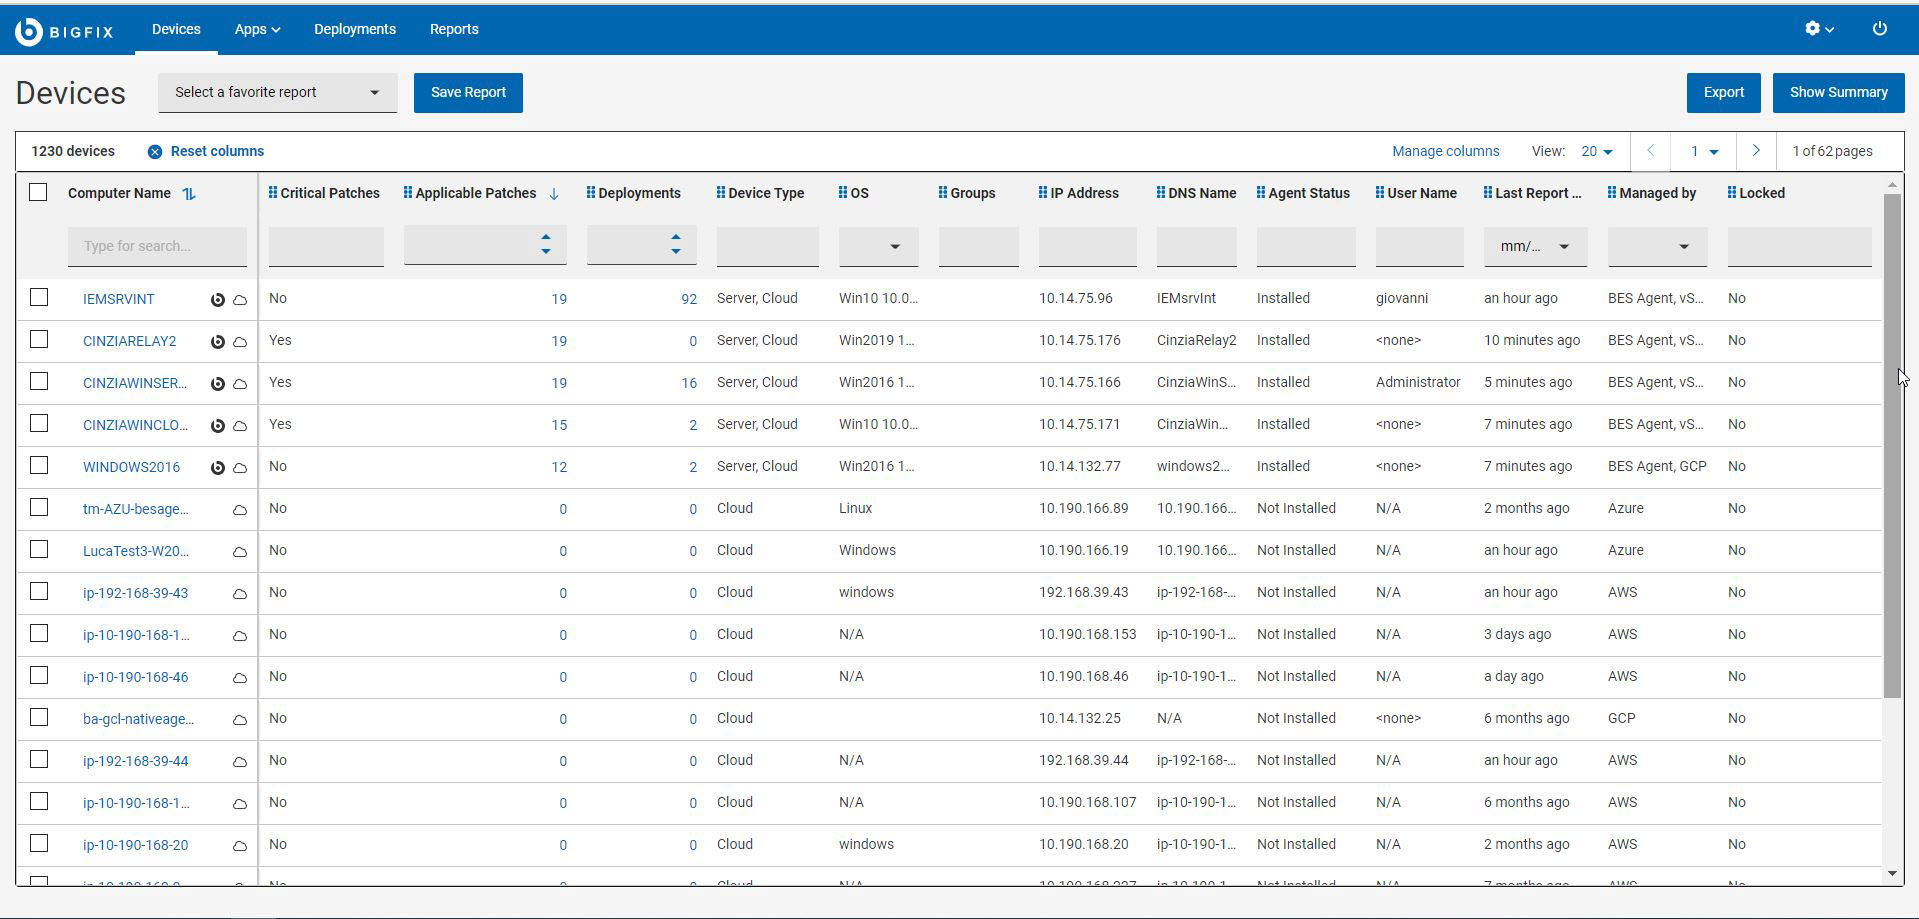
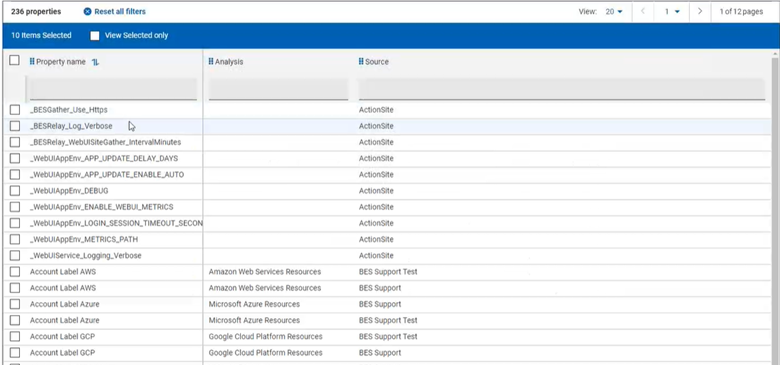
The following image shows the devices data grid with default property columns and their positions (Computer Name, Critical Patches, Applicable Patches, Deployments, Device Type, OS, Groups, IP Address, DNS Name, Agent Status, User Name, Last Report Time, Managed by, Locked). By default, the data is sorted based on the number of Application Patches in descending order.
Manage devices
- Deploy: From this
menu, you can deploy content of various types such as custom content,
patches, software, MDM policies and actions.Note: The option to deploy profiles is getting deprecated.
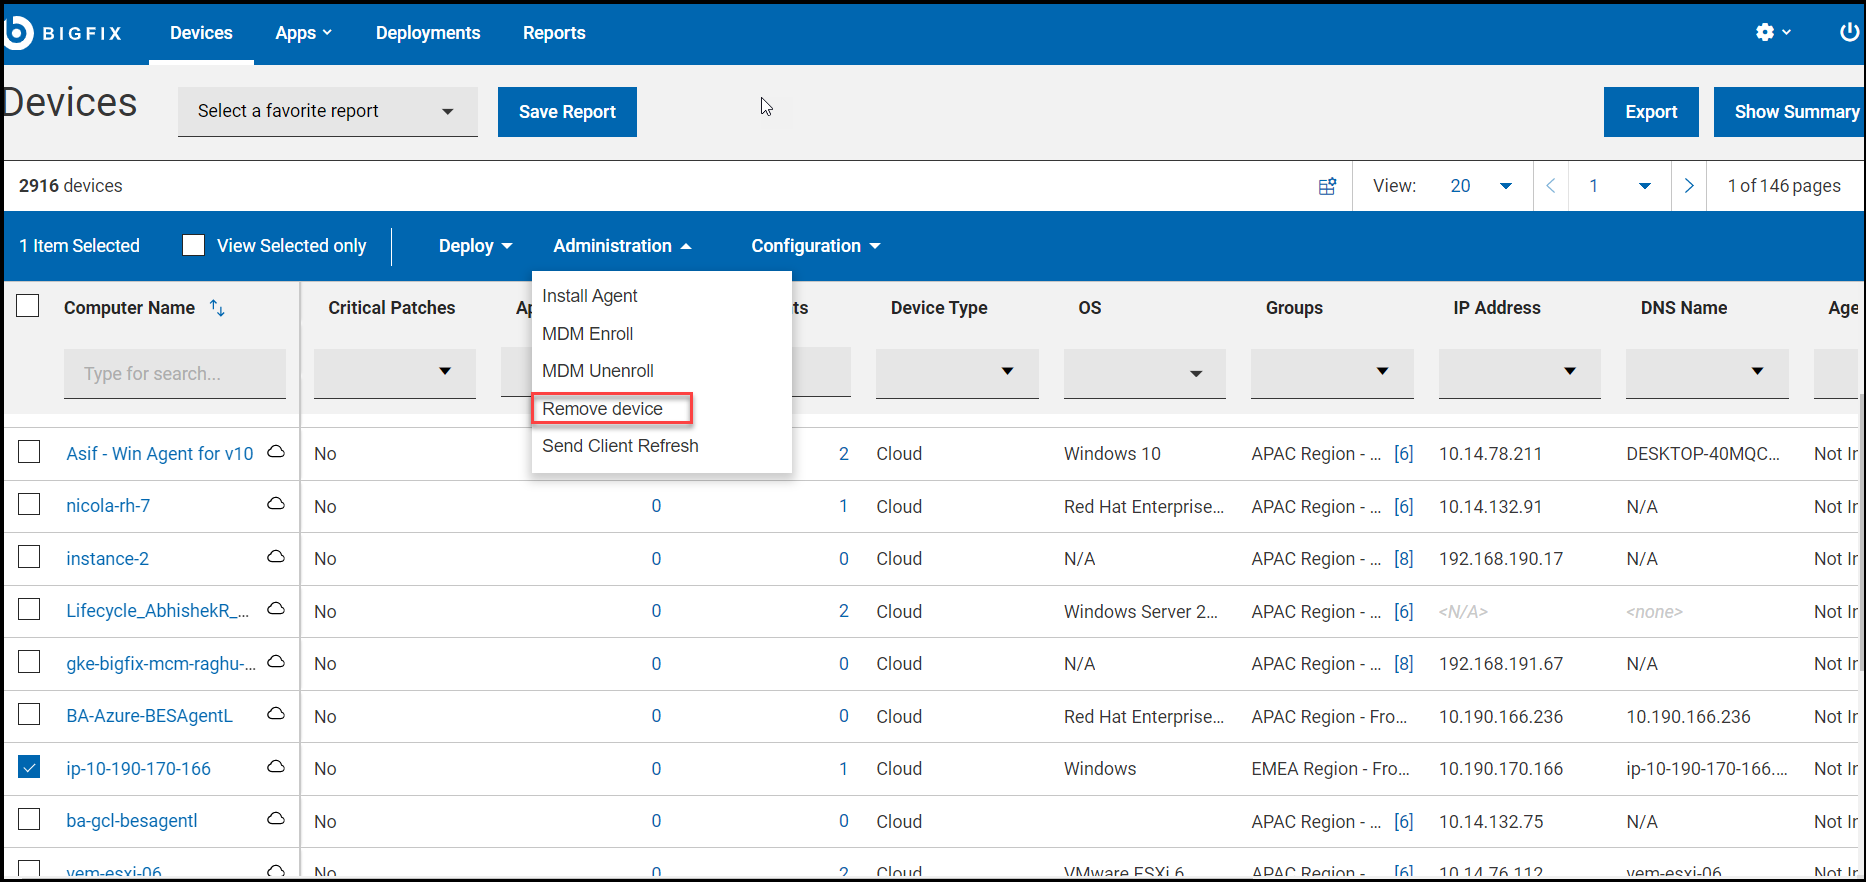
- Administration: From this menu, you can choose among
typical administrative tasks related to the devices, such us enrolling to
and unenrolling from MDM server, installing BigFix agent or sending the action for client refresh, and remove
device.Note: Operators can use the "Remove device" option to delete the selected computers. "Remove device" option from the UI performs a soft delete. When the "Client Removal Tool" runs, it will permanently delete the computer from the database. During that time, if the deleted device reports again then the related entry will be restored in the "Device view".
- Configuration: From this menu, you can send a message (if the target machine has SSA installed) or send a file or access Query application.
Computer Properties
- Reserved: A set of properties that in BigFix Platform are flagged as Reserved and Pre-defined properties. For example, BIOS date, the CPU type, free hard disk drive space, the operating system, memory, and user name.
- Aggregated: A set of properties that WebUI calculates, such as: Applicable
Patches, Deployments, Critical Patches, Groups, Agent Status, Cloud Tags and
Managed By.
- All computer properties other than Reserved and Aggregated properties retrieved by BigFix agent.
Refine results
- To filter device data:
- From the desired column, select your option from the
list.
or
- Click in the text field of the desired column and type the search
string.Note: For only a subset of reserved and aggregated computer properties, auto-suggest displays a list of suggested words based on the first few typed letters. For other properties, including user-defined computer properties, auto-suggest does not work, as it impacts the search performance.
- From the desired column, select your option from the
list.
- To speed up your search, combine filters.Note: By default, you can combine up to a maximum of five filters to process simultaneously. Exceeding the maximum number of filters affects the performance. The default value can be configured using the setting
_WebUIAppEnv_MAX_FILTERS_NUMBER. - To clear all selected filters, click Reset all filters
Customize devices data grid
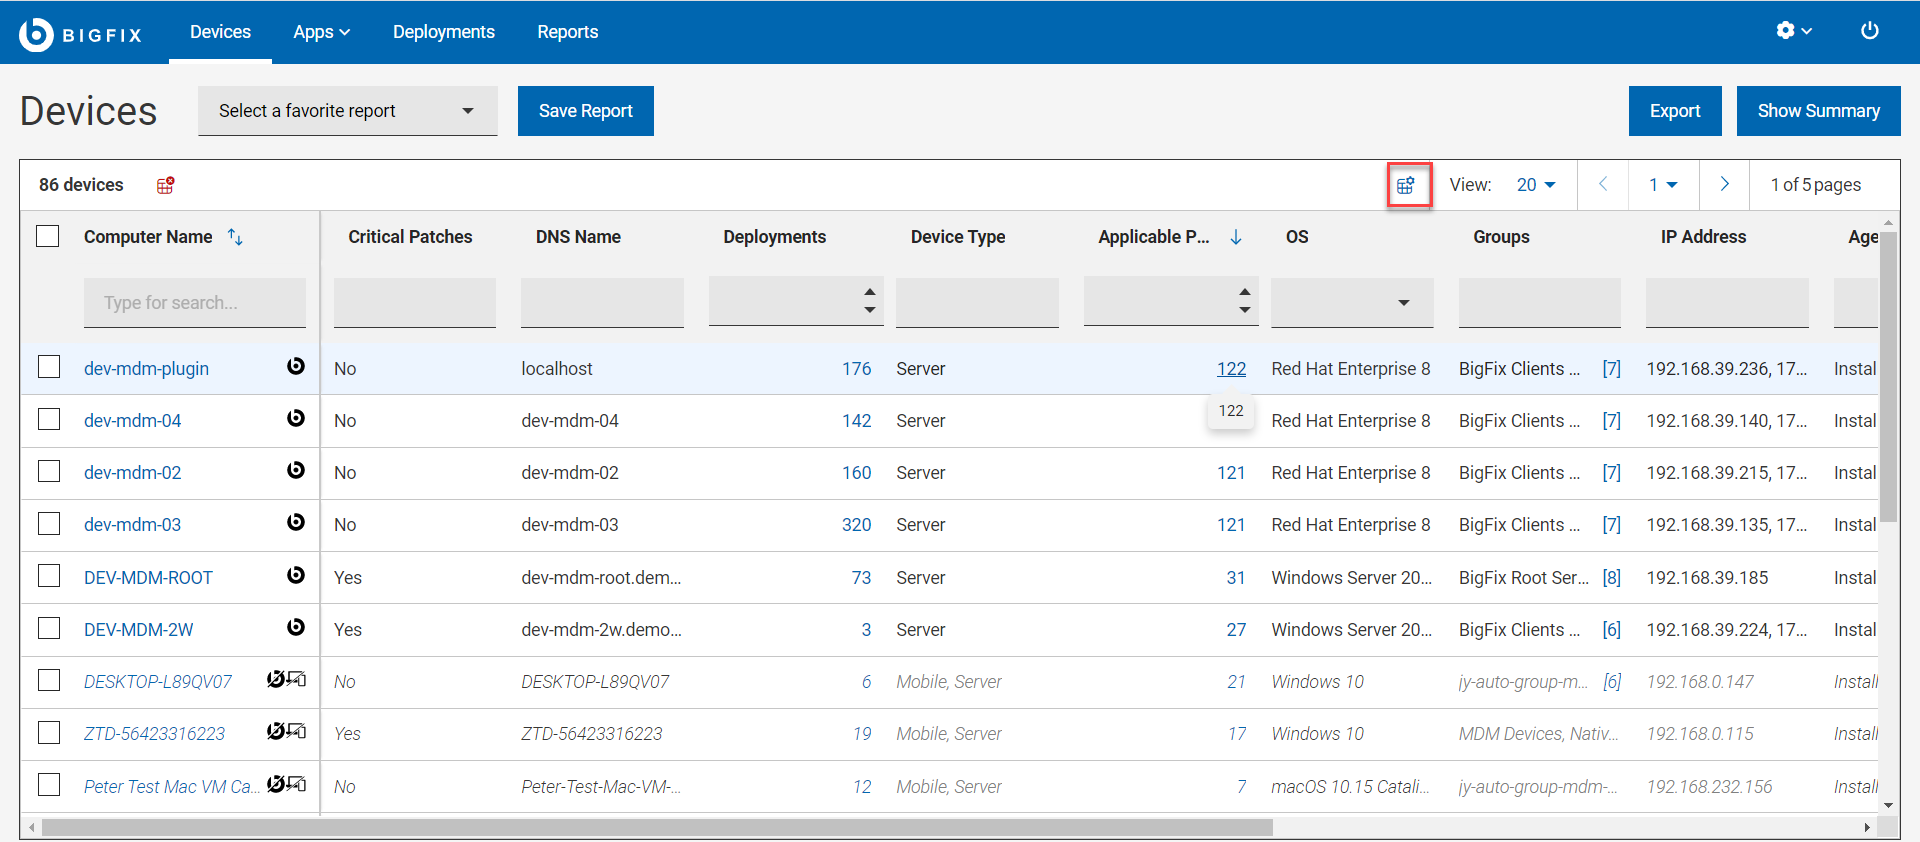
You can customize the data grid view by adding, removing, resizing, or changing the positions of the columns. You can also click Reset columns to return back to default view.- To include additional property column to the devices data grid
- Click Manage columns. The Other Property page
appears.
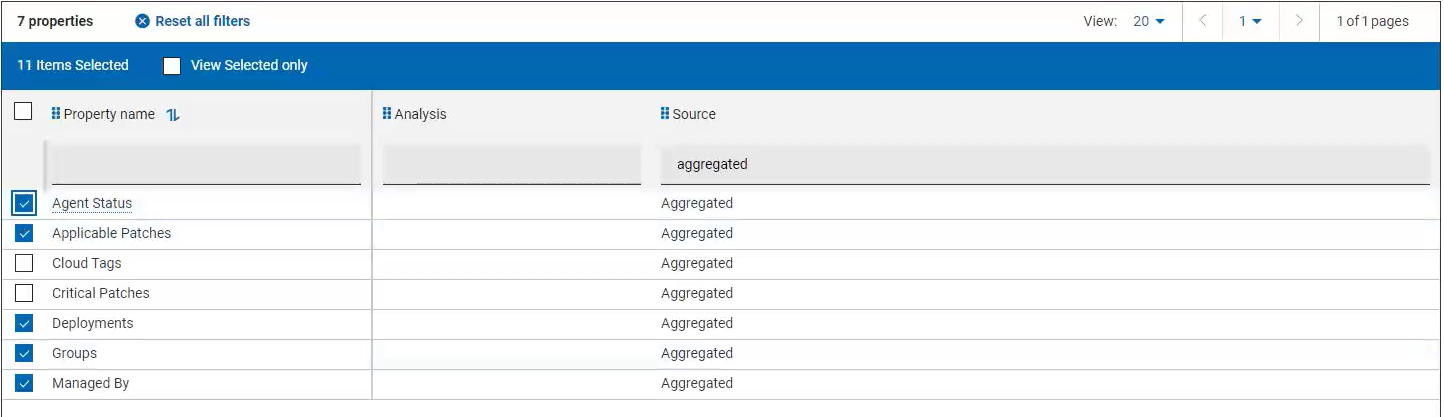
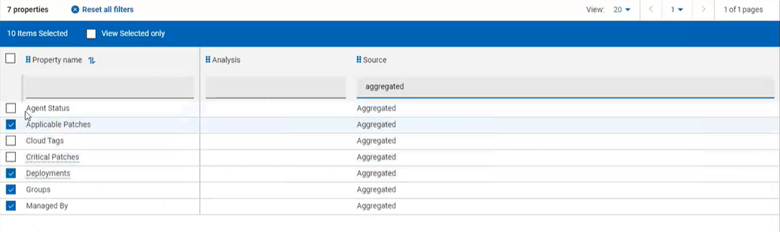
- Click in the text field of the desired column and type the search
string. The search result appears based on the entered string. For
example, under Source column, if you enter Aggregated the result
appears similar to the following image.
- Select the check box next to the desired Property name and click Save. The Devices page displays the selected property in a new column.
- Click Manage columns. The Other Property page
appears.
- To remove a property column from the devices data grid
- Click Manage column.
- In the Other Property page, enable View Selected only option. The result displays only the properties that are selected for the data grid view.
- Deselect one or more properties that you want to remove from the data grid and click Save. The Devices page displays the selected properties; the deselected property columns disappear.
- To resize the column width
- Mouse hover near the desired column border.
- Click and hold down the left mouse button, drag the border to the right to widen the column or to the left to make the column narrower, and release the mouse button when the desired width is reached.
- To change column position
- Mouse hover the desired column name.
- Click and hold down the left mouse button, drag and drop it to a desired position in the data grid.
Working with reports
Save reports
You can save the filtered and customized device report for future reference. You can also edit, update, or delete the reports as required. Mark a report as favorite report to access it quickly. For more information about working with reports, see Reports.
Export
You can export the filtered report in a .csv, .xlsx, or .pdf format.
- In the Devices page, select the required filters.
- Click Export.
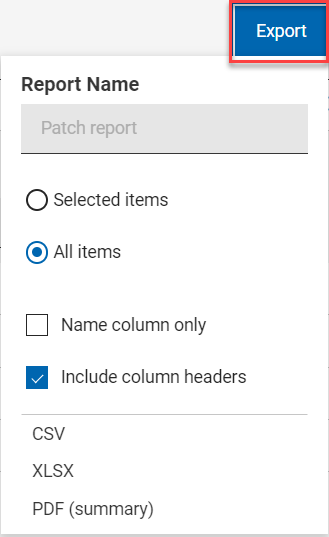
- The option Selected Items enables you to select items from the filtered result to export; All Items enables you to export all the items from the filtered list. Select the desired option.
- Name column only: Select this option if you want to export only the names of the filtered items.
- Include column headers: Select this option if you want to export details of every columns of an item.
- Select a file format (CSV, XLSX, or PDF) that you want to export to.
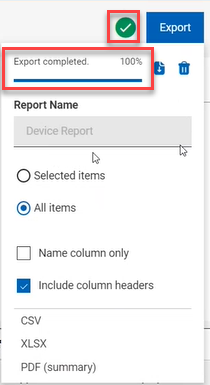
- The export starts and you can see the status in the progress bar.
- Once export is completed, a green tick mark appears to indicate the report is available to download.
- Exported report does not get download automatically. You need to click the Download button next to the progress bar to download.
- If you want to delete the exported report, click Delete button.
- During the export, you can navigate to other pages without interrupting
its progress.
- When you download, by default, the report gets downloaded into your Downloads folder with the default file name (Device_Report_mm_dd_yyyy_username). You can change the download settings in your browser to change the file name and download it into a preferred location. You can save the report to review it later and/or share it with interested stakeholders.
- If you have selected PDF format, a .zip file gets downloaded which contains a .csv file with numerical data and .pdf file with visual representation of the data.
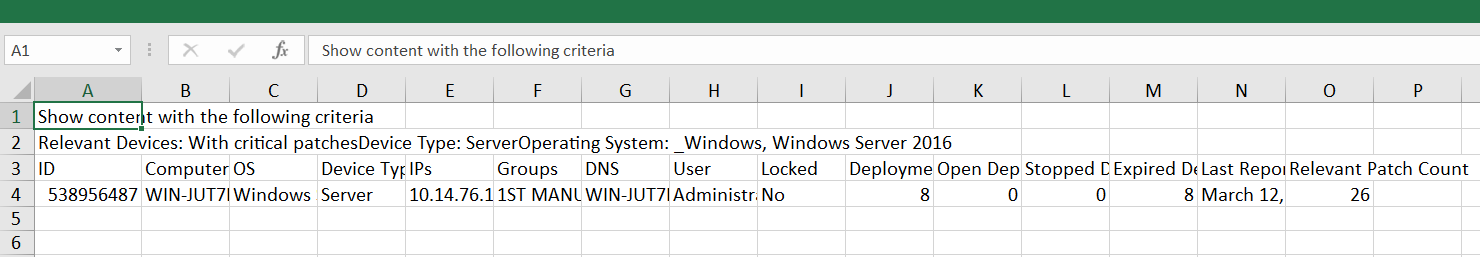
- The exported device report contains key details about your managed
devices that you have selected through the filters and search
criteria. The details include the operating system, device type, IP
address along with all the other details that you can see on the
screen when you expand every device. A sample report is shown
below:
Show summary
- In the Devices page, select the required filters.
- Click Show Summary. You can view the summary of all the
filtered devices as charts and tables. Mouse hover the interested areas on the
chart to get more details about the respective data point and the percentage
data. Mouse hover on any truncated labels to see the full text in the tool tip.
Clicking on a clickable area dynamically filters the relevant data, displays in
the device list, and displays the summary of the item you clicked on. You can
change filters or enter search text and the report dynamically displays the
relevant information.
- Device Type By Report Time: Displays the total number of unique devices reported over a period of time against every device type.
- By OS Family: Displays total number of devices from each operating system. The table is sorted alphabetically by OS names.
- By Largest Group: Displays up to the 10 largest computer groups along with the device counts that are relevant as per filter and search criteria.