Cell Waterfall report example
This example shows how you can use a Cell Waterfall report to identify processes that affect output volume. The report provides details about the output by percentage and quantity.
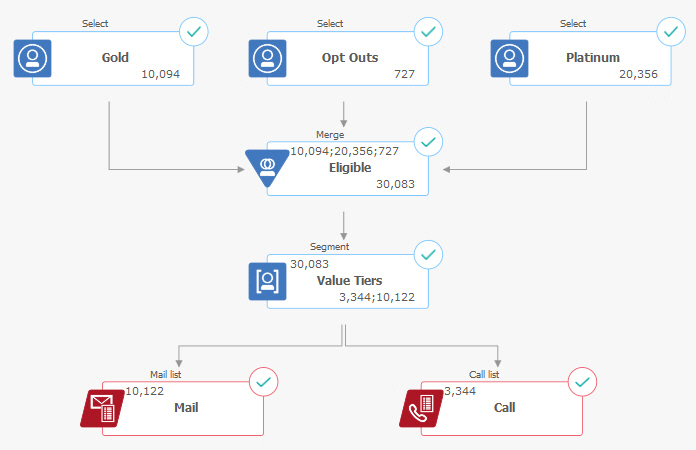
This example analyzes the output from a Select process named "Gold" in the campaign flowchart shown below.
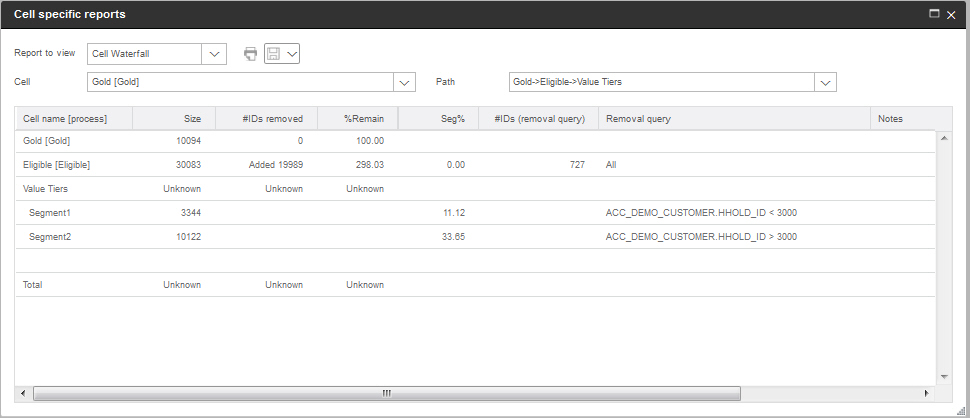
Each cell is identified by its output cell name, plus a [process name] shown in square brackets. These names were assigned on the General tab of the process configuration dialog.
This example report shows the following progression:
- The IDs in the Gold cell are passed to a Merge process named Eligible.
- You can see that some IDs were added and some were removed.
- By looking at the flowchart, you can see that the Platinum (Select) process added some IDs and the Opt Outs (Select) process removed some IDs.
- The Eligible IDs (Gold and Platinum, minus Opt-Outs) are passed to a Segment process named Value Tiers.
- The Segment process divides the Eligible IDs into multiple contact channels.
The Total row shows how many IDs the Gold process originally selected. This row also shows the number and percentage of Gold IDs that remain.
Sankey Flowchart
Click on the Sankey button to see the whole flowchart waterfall model. This flowchart will display details of all the process box. Hover on each process box to view details like PB name, Size, Percent remain, Num removed and Removal Query.