Viewing PMI performance metrics
There are a variety of tools you can use to view performance metrics collected by the IBM® WebSphere® PMI tool.
About this task
There are several ways to view performance data; including:
- Using the IBM Performance Viewer that is incorporated into the Integrated Solutions Console, as explained.
- Manually sampling the server's PMI metrics by installing the WebSphere PerfServlet on your
server.
After installing PerfServlet, you can view the metrics in an XML document by browsing to the following address: http://Gateway_host:9080/wasPerfTool/servlet/perfservlet?module=STGWStats_Group
- Querying the server's PerfMBean object using the wsadmin console.
- Creating your own periodic sampler utility, using the following utility as a reference: stgw_server_root/config/adminscripts/gw_perfservlet_retrieve.bash
- Using a third-party tool performance management tool, such as Performance Monitoring for Web
Infrastructure, to review your performance metrics.
For example, the tool lets you collect, analyze, alert, and present the Sametime® Gateway performance metrics.
Procedure
To view the PMI metrics through the Performance Viewer:
- In the Integrated Solutions Console, click .
- Click RTCGWServer.
- Expand Performance Modules.
- Select either, or both, of the following options:
- STGWStats_Group to see only group-level data
- to see community-level data
- Click View Module.
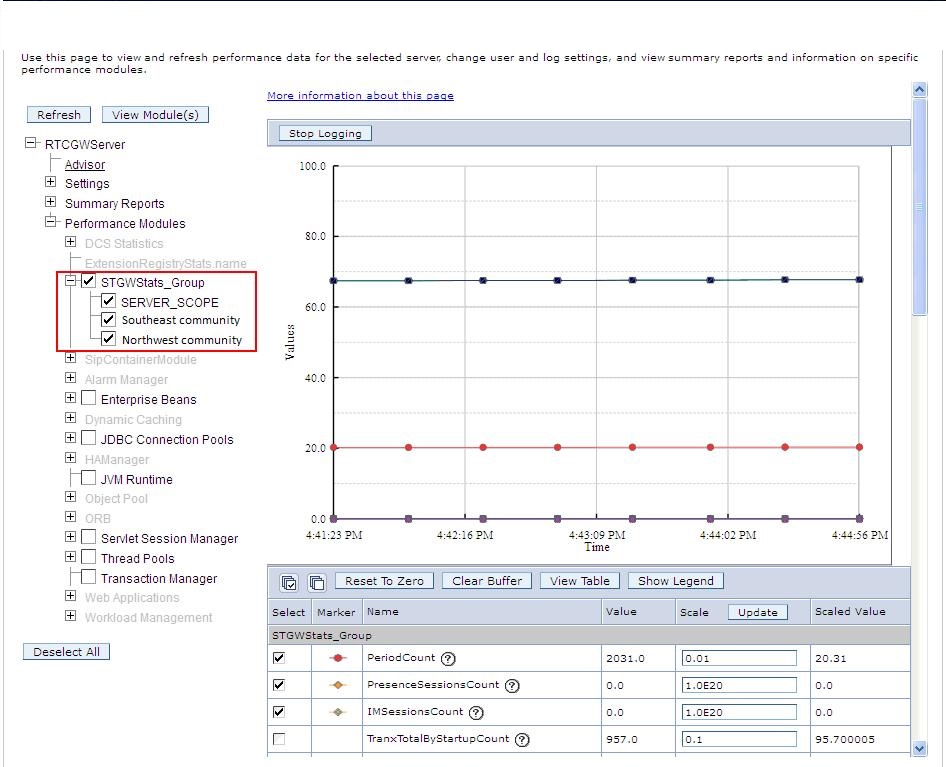
Example
In the image, STGWStats_Group is
selected to show community averages, plus community Southeast and
community Northwest are also selected to show performance
data for the individual communities.