Installing the Kubernetes web-based dashboard
Install the Kubernetes web-based dashboard for use in monitoring Component Pack for HCL Connections™.
Before you begin
Ensure the following prerequisites are in place:
- Kubernetes cluster is installed and running
- Internet connection (pull Kubernetes Dashboard manifest and image)
About this task
Kubernetes Dashboard is a general purpose, web-based UI for Kubernetes clusters. It allows users
to manage applications running in the cluster and troubleshoot them, as well as manage the cluster
itself.
- View Workload Status
- View Node status
- View logs associated with your running pods
Procedure
-
Install the Kubernetes dashboard:
kubectl apply -f https://raw.githubusercontent.com/kubernetes/dashboard/master/aio/deploy/recommended/kubernetes-dashboard.yaml -
Add heapster (which provides graph charts for the dashboard) by running the following set of
commands:
kubectl create -f https://raw.githubusercontent.com/kubernetes/heapster/master/deploy/kube-config/influxdb/grafana.yaml kubectl create -f https://raw.githubusercontent.com/kubernetes/heapster/master/deploy/kube-config/influxdb/heapster.yaml kubectl create -f https://raw.githubusercontent.com/kubernetes/heapster/master/deploy/kube-config/influxdb/influxdb.yaml kubectl create -f https://raw.githubusercontent.com/kubernetes/heapster/master/deploy/kube-config/rbac/heapster-rbac.yaml -
Check if your dashboard is running listing the pods in the namespace kube-system with the
following command. You should see a kubernetes-dashboard-xxx pod with the status "running":
Run the following command:
kubectl -n kube-system get pod | grep kubernetes-dashboardSample output:
kubernetes-dashboard-5dd89b9875-mctjx 1/1 Running 0 46m - Locate your kubeconfig or config file which you use to run kubectl commands. If you used kubeadm, you can find them in ~/.kube/config or /etc/kubernetes/admin.conf
-
Export a single file (.p12) with the following two certificates: the client-certificate-data,
and the client-key-data:
mkdir -p ${HOME}/dashboard
cd ${HOME}/dashboard
grep 'client-certificate-data' ~/.kube/config | head -n 1 | awk '{print $2}' | base64 -d >> kubecfg.crt
grep 'client-key-data' ~/.kube/config | head -n 1 | awk '{print $2}' | base64 -d >> kubecfg.key
openssl pkcs12 -export -clcerts -inkey kubecfg.key -in kubecfg.crt -out kubecfg.p12 -name "kubernetes-client"
Note: You will be prompted for an export password. Type in an arbitrary value. Make a note of this value as it will be needed in a later stepTip: For production systems each user should have its own certificates. -
Create a Service Account with name admin-user:
kubectl apply -f extractedFolder/microservices_connections/hybridcloud/support/dashboard-admin.yaml -
Find the token that will be used to log in to the dashboard by running the following
command:
kubectl -n kube-system describe secret $(kubectl -n kube-system get secret | grep admin-user | awk '{print $1}')Sample output
Name: admin-user-token-6gl6l Namespace: kube-system Labels: <none> Annotations: kubernetes.io/service-account.name=admin-user kubernetes.io/service-account.uid=b16afba9-dfec-11e7-bbb9-901b0e532516 Type: kubernetes.io/service-account-token Data ==== ca.crt: 1025 bytes namespace: 11 bytes token: eyJhbGciOiJSUzI1NiIsInR5cCI6IkpXVCJ9.eyJpc3MiOiJrdWJlcm5ldGVzL3NlcnZpY2VhY2NvdW50Iiwia3ViZXJ uZXRlcy5pby9zZXJ2aWNlYWNjb3VudC9uYW1lc3BhY2UiOiJrdWJlLXN5c3RlbSIsImt1YmVybmV0ZXMuaW8vc2VydmljZWFjY291bn Qvc2VjcmV0Lm5hbWUiOiJhZG1pbi11c2VyLXRva2VuLTZnbDZsIiwia3ViZXJuZXRlcy5pby9zZXJ2aWNlYWNjb3VudC9zZXJ2aWNlL WFjY291bnQubmFtZSI6ImFkbWluLXVzZXIiLCJrdWJlcm5ldGVzLmlvL3NlcnZpY2VhY2NvdW50L3NlcnZpY2UtYWNjb3VudC51aWQiOi JiMTZhZmJhOS1kZmVjLTExZTctYmJiOS05MDFiMGU1MzI1MTYiLCJzdWIiOiJzeXN0ZW06c2VydmljZWFjY291bnQ6a3ViZS1zeXN0ZW06 YWRtaW4tdXNlciJ9.M70CU3lbu3PP4OjhFms8PVL5pQKj-jj4RNSLA4YmQfTXpPUuxqXjiTf094_Rzr0fgN_IVX6gC4fiNUL5ynx9KU- lkPfk0HnX8scxfJNzypL039mpGt0bbe1IXKSIRaq_9VW59Xz-yBUhycYcKPO9RM2Qa1Ax29nqNVko4vLn1_1wPqJ6XSq3GYI8anTzV8Fku4 jasUwjrws6Cn6_sPEGmL54sq5R4Z5afUtv-mItTmqZZdxnkRqcJLlg2Y8WbCPogErbsaCDJoABQ7ppaqHetwfM_0yMun6ABOQbIwwl8psp JhpplKwyo700OSpvTT9zlBsu-b35lzXGBRHzv5g_RA - Copy the contents of the token field to your clipboard
-
Import the kubecfg.p12 certificate (created during Step 5 above) to the host Operating System
from where you will access the Kubernetes Dashboard. For example, your personal laptop.
Tip: The steps to import the kubecfg.p12 certificate will vary depending on the OS being used. For example, If windows, double click the kubecfg.p12 file and use the import wizard.
-
Open your browser, and visit the Kubernetes Dashboard URL:
https://<master-ip>:6443/api/v1/namespaces/kube-system/services/https:kubernetes-dashboard:/proxy/For high availability deployments, replace <master-ip> with the virtual master IP or load balancer of the HA cluster.Note: If needed:- Clear your browser cache to force the re-import of newly created certificates
- You will be prompted multiple times to accept a security certificate.
-
Choose token on the login page, and paste the token you copied in step 8.
Figure 1. The Kubernetes dashboard 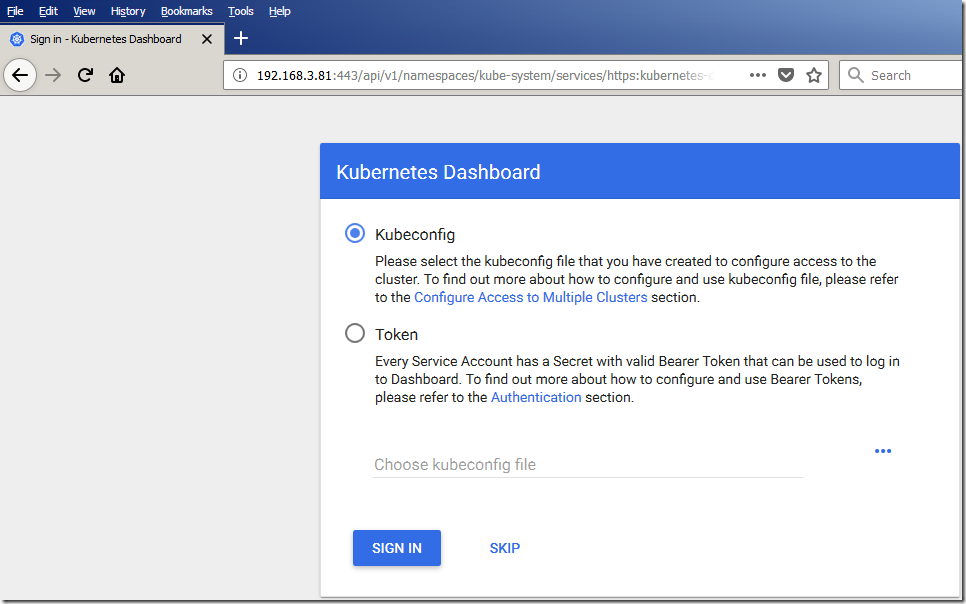
-
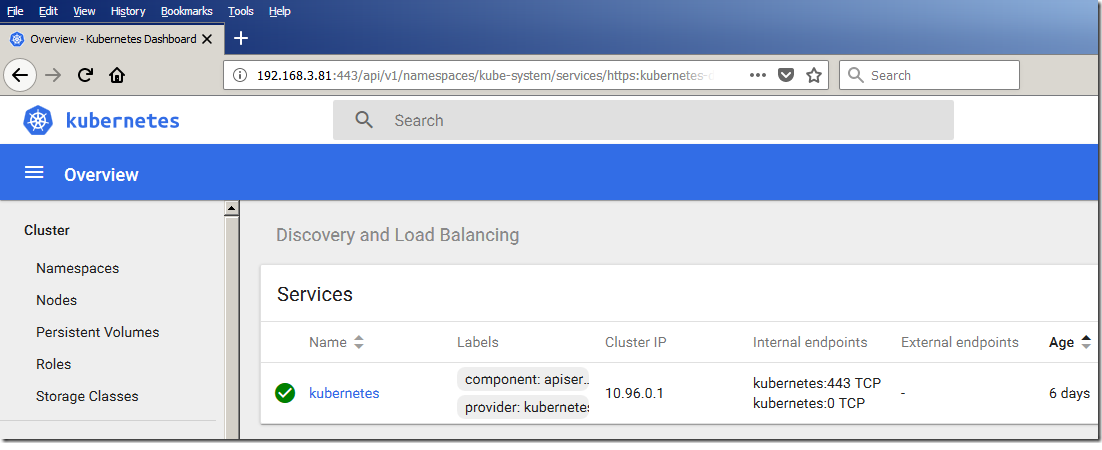
Click "SIGN IN" and you should be able to see your Kubernetes Dashboard fully
operational.
Figure 2. The home page of the Kubernetes dashboard