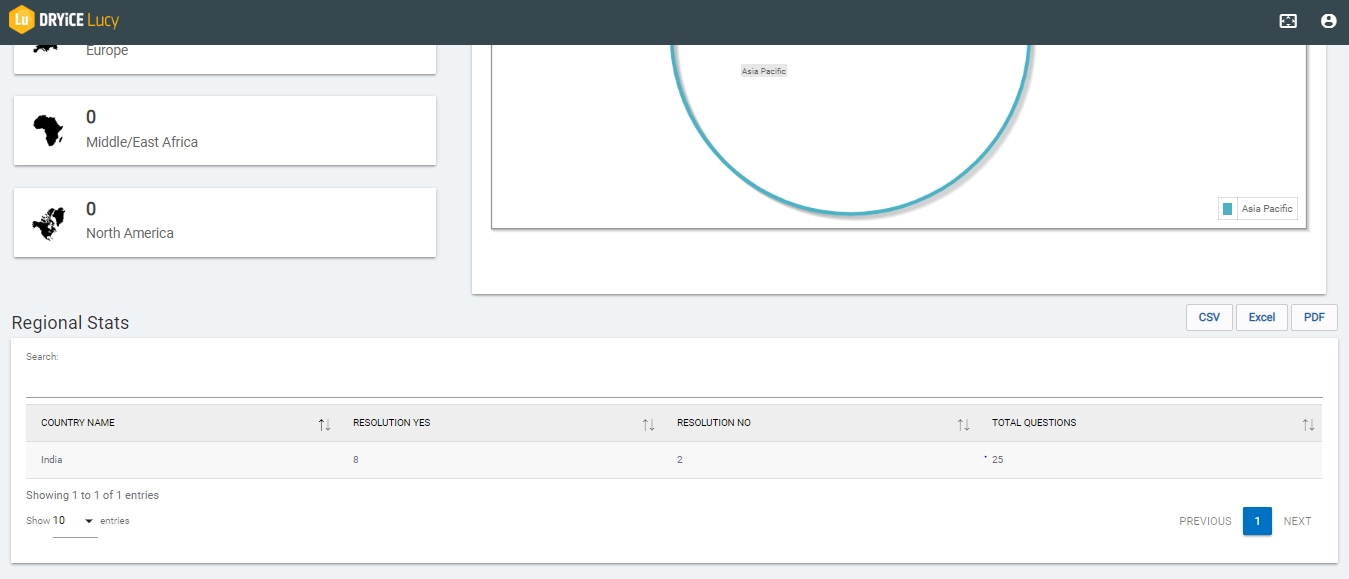
A pie chart representation of the questions asked per region
(as shown in Figure 133 - Infographics
Landing Page), along with a Stats on the number of questions
asked which can be seen on the left side under Quick Stats. Each
region drawn on the pie chart is clickable, which when clicked,
displays the stats of that region consisting of the countries
contributing to the total number of questions along with the
respective counts and resolution response received under the
Quick Stats section as shown in the Figure
below: