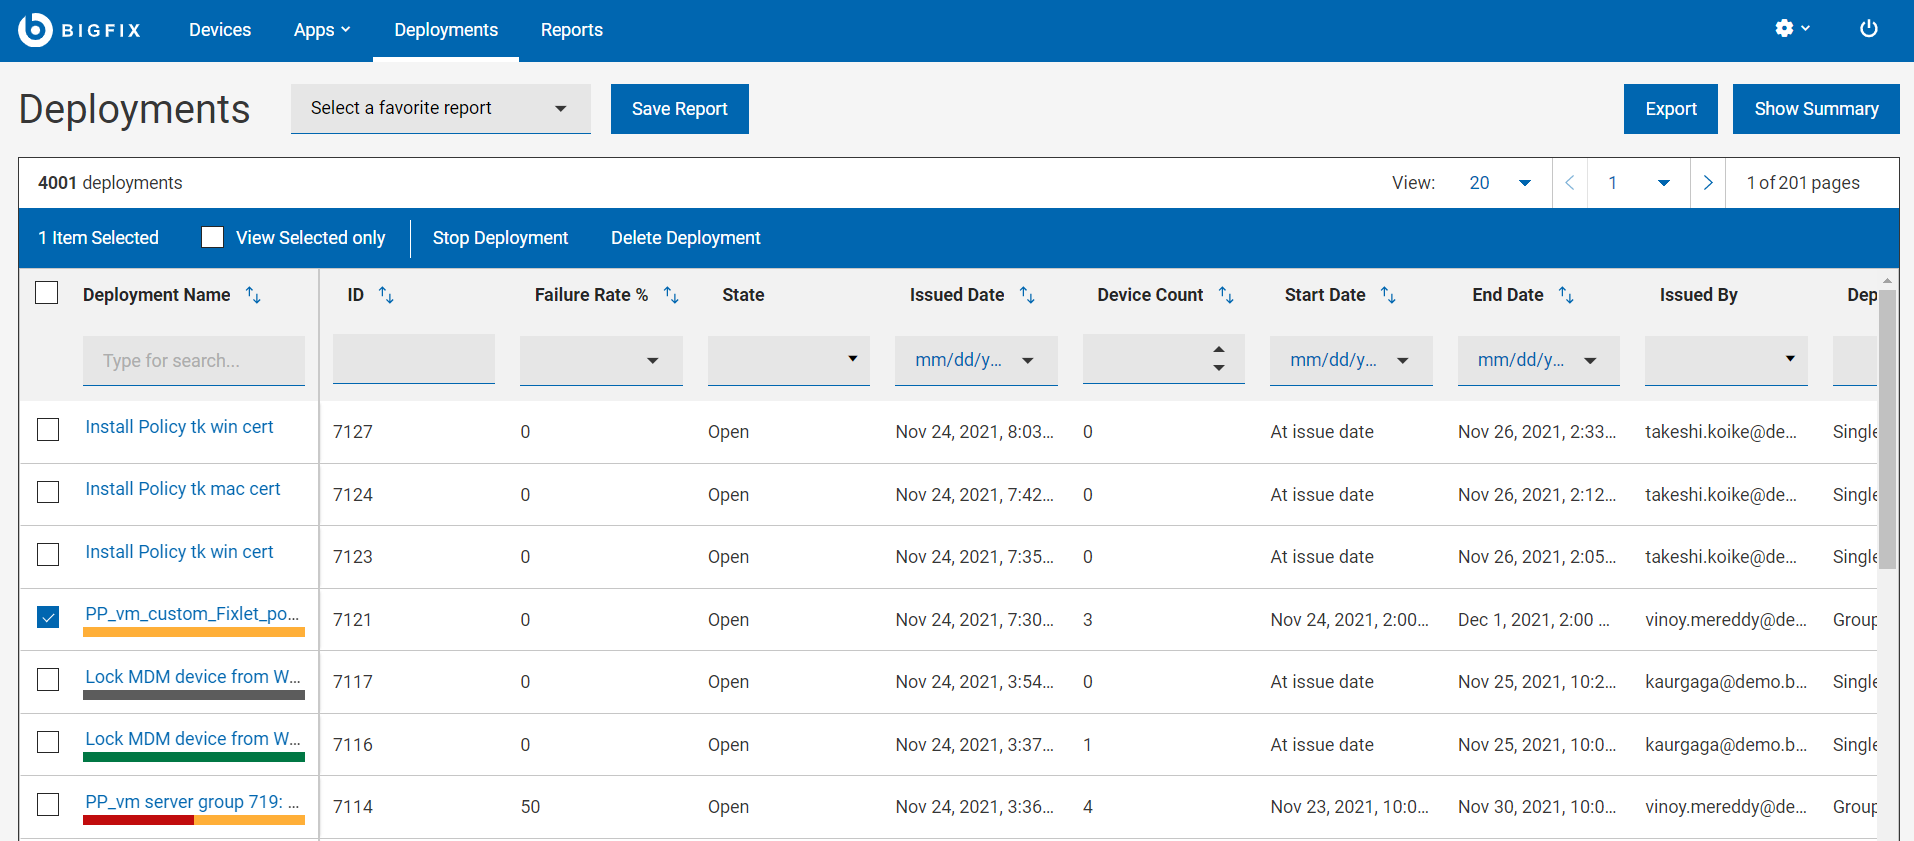
The Deployment List
View the list of all deployments, create customized deployment summary reports to review the detailed information about each deployment.
To access the Deployments page, from the WebUI main page, select Deployments.
WebUI deployment screens list every deployment irrespective of the permission settings. While operators can see all deployments, permissions continue to govern the actions they can take. For example, an operator who cannot access the WebUI patch screens can see all patch deployments, but cannot stop a patch deployment that is running.
The WebUI displays all actions initiated from the WebUI, the BigFix console, and external sites, including BES Support.
Manage deployments
- Stop Deployment that are in
Openstate. - Delete deployments that are in
ExpiredorStoppedstate.
Deployment status bar
The deployment name cell also displays a colored bar that gives a quick summary of the Deployment Status of each deployment.
Refine results
- Sort by: You can sort the list by:
- Deployment Name
- ID
- Failure Rate
- Issued Date
- Device Count
- Start Date
- End Date
- Filter: To filter deployments data, click in the text field of the
desired column and type the search string; or from the desired column, select
your option from the list.
- To speed up your search, combine filters.
- Deployment Name: Filter the deployments containing the entered search string.
- ID: Filter the deployments containing the entered numbers in their ID.
- Failure Rate %: Filter deployments with specified failure rate range.
- State: Filter all expired, open, or stopped deployments.
- Issued Date: Filter deployments issued within a day, week, month, quarter, or within a specific date or date range.
- Device Count: Filter the deployments that are applicable or issued on the specified minimum number of devices.
- Start Date: Filter all the deployments that start within a day, week, month, quarter, or within a specific date or date range.
- End Date: Filter all the deployments that end within a day, week, month, quarter, or within a specific date or date range.
- Issued By: Filter the deployments issued by the logged in user or a specified user.
- Deployment Type: Filter all deployments targeted for a single content (Fixlet, software, task) or a group (multiple action group, baseline).
- Behaviors: Filter deployments with a specific behavior such as deployments with user message, offer type deployments, open-ended deployments, or deployments that restart endpoints.
- Application Type: Filter deployments that belong to a particular application type.
- Source Site: Filter all the deployments that belong to a specific site.
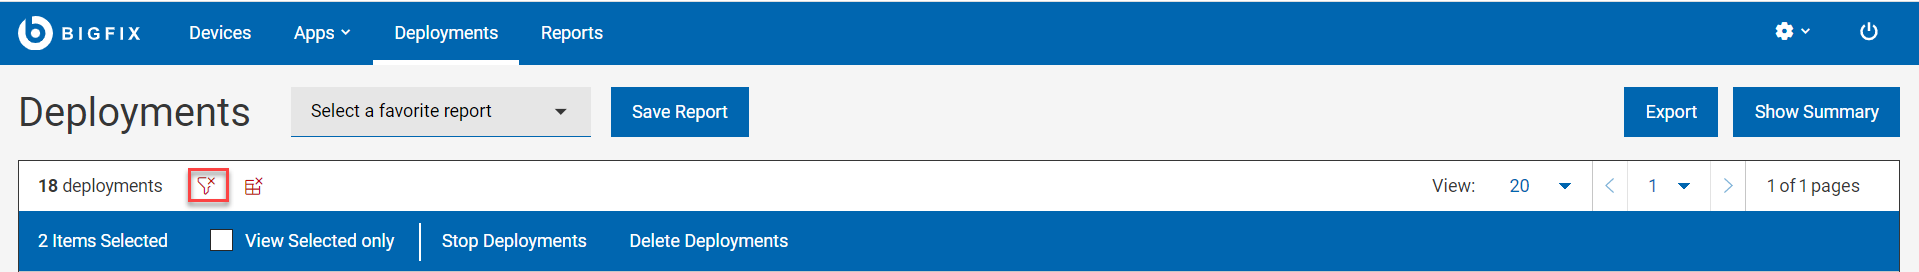
Note: By default, you can combine up to a maximum of five filters to process simultaneously. Exceeding the maximum number of filters affects the performance. The default value can be configured using the setting_WebUIAppEnv_MAX_FILTERS_NUMBER. - To clear all selected filters, click Reset all filters
- To speed up your search, combine filters.
Deployment reports
- Save Report: Save the report for future reference and edit, update, or delete as required. For more information, see Reports.
- Show Summary:
- In the Deployments page, select the required filters.
- Click Show Summary. You can view the deployment data as charts and tables. Mouse over the interested areas on the chart to get more details about the respective data point and the percentage data. Mouse over on any truncated labels to see the full text in the tool tip. You can change filters or enter search text and the report dynamically displays the relevant information.
- Deployment State By Deployment Date: Displays total number of deployments and their deployment state since the start date of deployment for a period of time.
- By Failure Rate (%): Displays total number of deployments and their failure rate under different categories from 0 to 100.
- By Application Type: Displays total number of deployments for each application type.
- Export:
You can export the filtered report in a .csv, .xlsx, or .pdf format.
- In the Devices page, select the required filters.
- Click Export To.
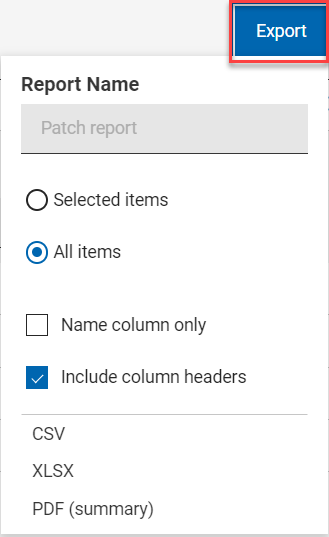
- The option Selected Items allows you to export select items from the filtered result; All Items allows you to export all the items from the filtered list. Select the desired option.
- Name column only: Select this option if you want to export only the names of the filtered items.
- Include column headers: Select this option if you want to export
details of every default columns of an item.Note: If you have displayed columns other than the default columns, you can export name column only.
- Select a file format (CSV, XLSX, or PDF) that you want to export to.
- By default, the report gets downloaded into your Downloads folder with the default file name (Device_Report_mm_dd_yyyy_username). You can change the download settings in your browser to change the file name and download it into a preferred location. You can save the report to review it later and/or share it with interested stakeholders.
- If you have selected PDF format, a .zip file gets downloaded which contains a .csv file with numerical data and .pdf file with visual representation of the data.
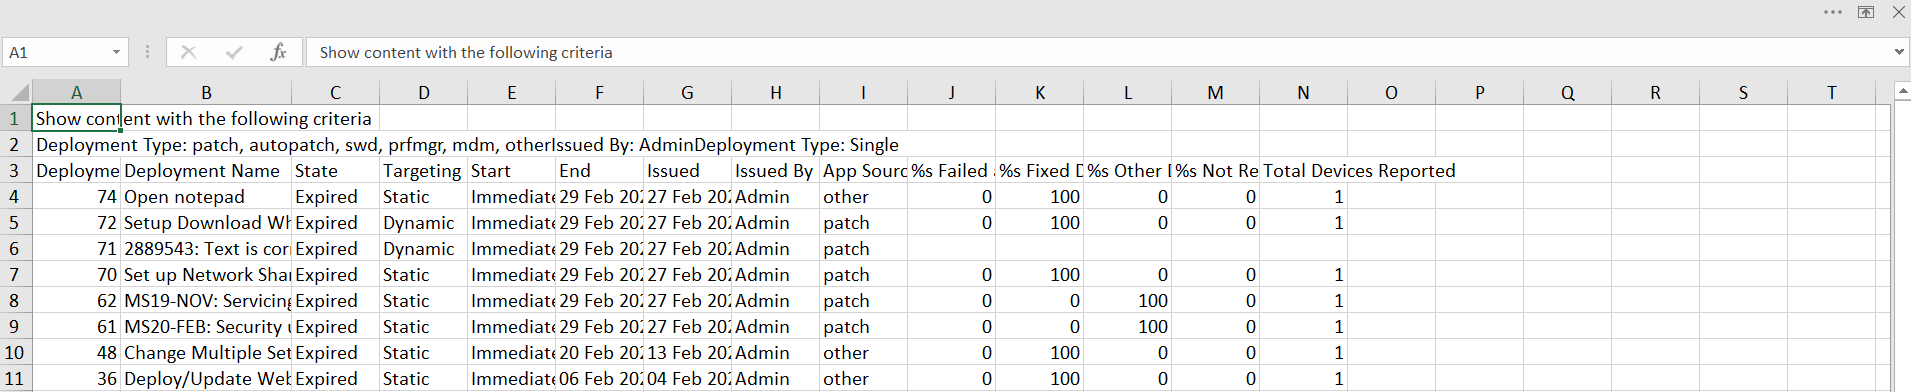
- The exported deployment report contains key details
about your deployments that you have selected through
the filters and search criteria. The details include
such as deployment ID, deployment name, state of the
deployment along with all the other details that you can
see on the screen when you expand every deployment. A
sample report is shown below: