Working with the cloud plugin dashboard
The information displayed by the Cloud Plugin Dashboard.
Before you begin
About this task
To access the Cloud Plugin Dashboard, run the following steps on the BigFix Console:
Procedure
- Click the All Content domain on the leftmost panel of the console.
- Expand the Dashboards entry.
- Expand the BES Support entry.
-
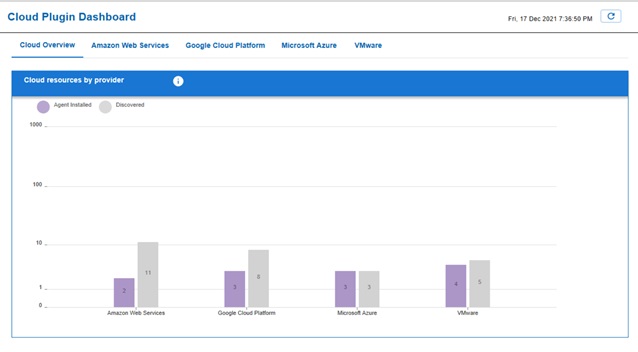
Click Cloud Plugin Dashboard. The dashboard is
displayed.

The Cloud Overview tab shows all discovered cloud resources, both managed by a BigFix Agent and unmanaged. The bar in violet indicates cloud resources on which the BigFix Agent is installed. The bar in gray indicates cloud resources on which the BigFix Agent is not installed yet.
When clicking on a violet bar or on a gray bar, details about all cloud resources represented by that bar are shown in a tabular format. You can then filter the items listed in the table by any column name. The "Name" column contains hyperlinks to the properties of the corresponding computers.
- The Amazon Web Services tab contains key information about the cloud resources discovered by the AWS plugin.
- The Microsoft Azure tab contains key information about the cloud resources discovered by the Azure plugin.
- The VMware tab contains key information about the cloud resources discovered by the VMware plugin.
- The Google Cloud Platform tab contains key information about the cloud resources discovered by the Google Cloud Platform plugin.