Single scan view
This view collects together all the data for a specific DAST or SAST scan, including all executions of the scan.
General
The upper area shows the scan name. Select the specific execution of the scan to view from a drop-down list by date .
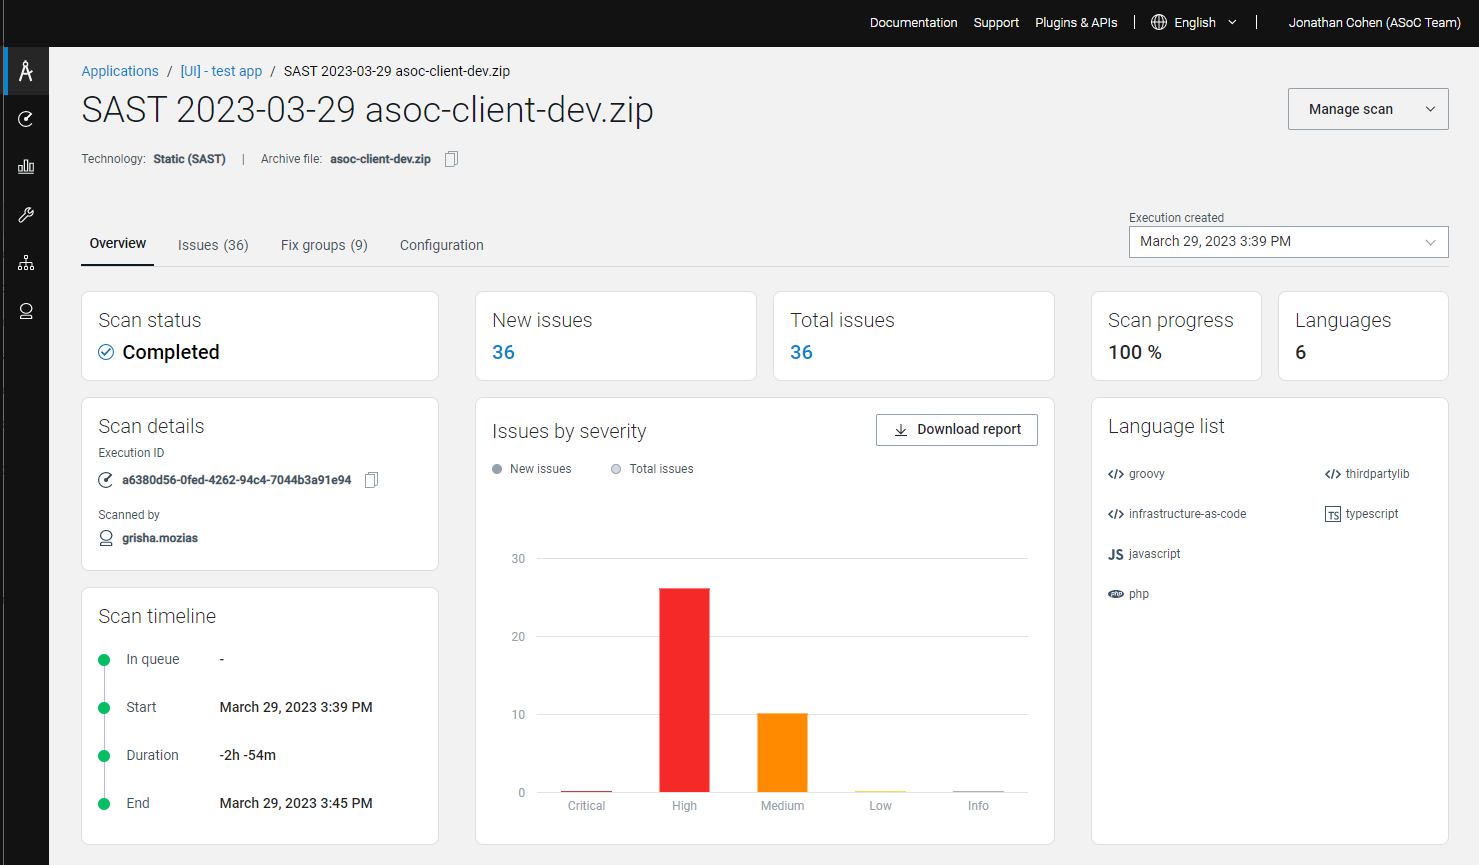
Overview
For the selected scan execution, this tab displays:
- Details: Status, start and end dates, scanned by, and duration and number of new and active issues.
- Coverage: Number of visited pages and tested elements
- Issues by Severity chart
- Execution logNote: The log pane shows only the latest section of the log. To see the whole log, click the Download link.
Possible scan statuses are:
- Configuration saved: The scan has been configured but not yet started by the user.
- Queued: You started the scan, but it is not yet running due to the limit on the number of concurrent scans. It will run as soon as allowed by your subscription.
- Initialized: You started the scan and it will start running within a few seconds.
- Running: Scan in progress.
- Pausing/Paused: You paused the scan. Click Resume to continue.
- Under review: The scan configuration requires review my our support team and will continue when this has been done.
- Completed: Scan completed successfully.
- Failed: Scan failed.
Issues
For the selected scan execution, this tab displays a list of all active and
non-complaint issues by default. Filters are available, and the columns
shown can be selected from the drop-down list.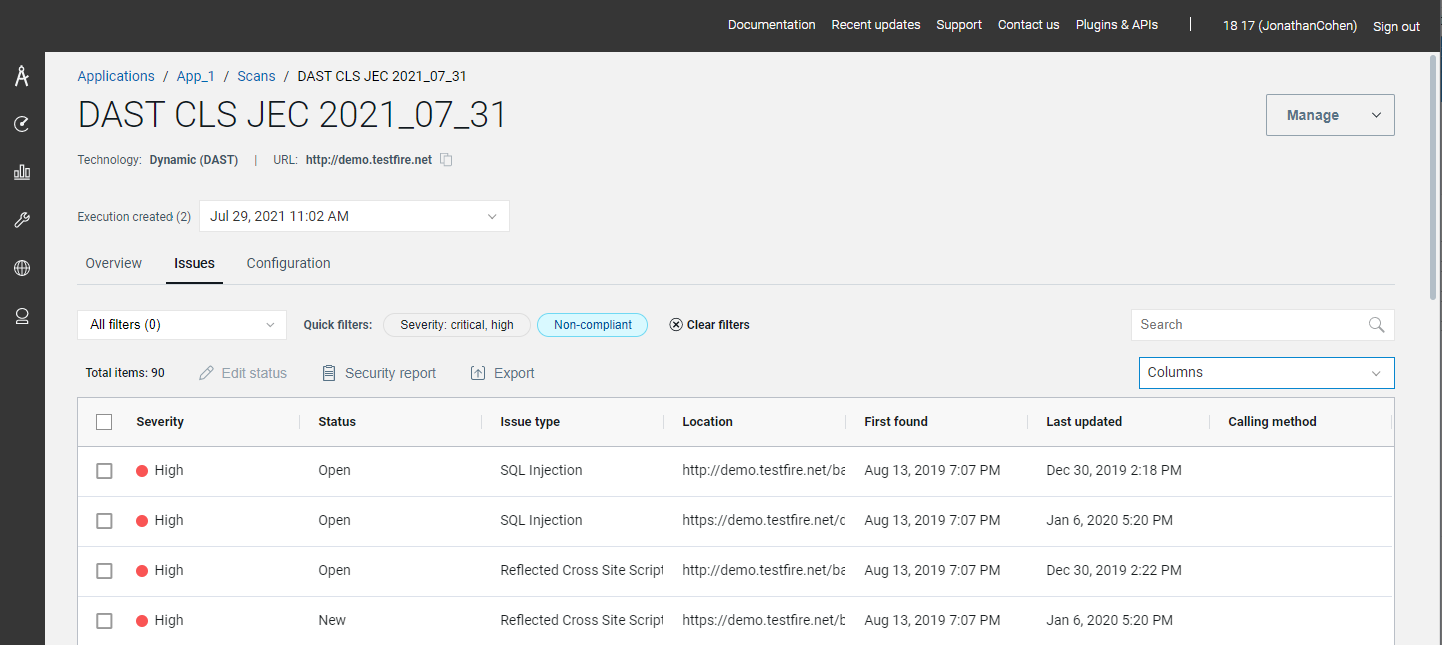
Fix groups
For the selected scan execution, this tab displays the fix groups for the issues found.
Configuration
For the selected scan execution, this tab displays (where
applicable):
- Scan and execution IDs
- URL (where the scan started) and domains
- Login type
- Explore type (automatic or guided)
- Network type (public or private)
- Test options (optimization and policy used)