Crosstab report styles
Use the styles included with the global report style sheet, GlobalReportStyles.css, to format crosstab reports.
The following table shows formatting from the GlobalStyleSheet.css style sheet for crosstab reports:
| Item | Style |
|---|---|
| Cells | Transparent background; 1 px silver line borders |
| Measure cell (upper left) | 1.5 pt black line separates the cell from the rest of the crosstable |
| Outer level totals | Gray/offwhite background |
Additionally, when you create a new list report, use the following guidelines to match the existing reports.
- Use 1.5 pt black borders to separate summarization from measures.
- Use 1.5 black borders to group logical column groupings.
- As a general guideline, avoid summarizing both columns and rows in the same report.
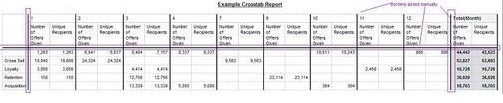
The following example shows a crosstab report that does not use the global styles.
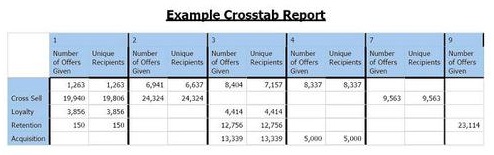
The following example shows a crosstab report that uses the global styles and has 1.5 px borders that are applied to show column groupings.