Example: Contact and response flowcharts
This example shows two flowcharts that were designed for a marketing campaign that uses multiple channels to deliver an offer to customers who otherwise might be lost through attrition.
- A contact flowchart generates lists of customers to whom the offer will be sent, using a different channel for each segment.
- A response flowchart tracks responses to the offer and makes the response data available for reporting and analysis.
Contact flowchart
This example shows a simple flowchart for contacting customers for a marketing campaign.
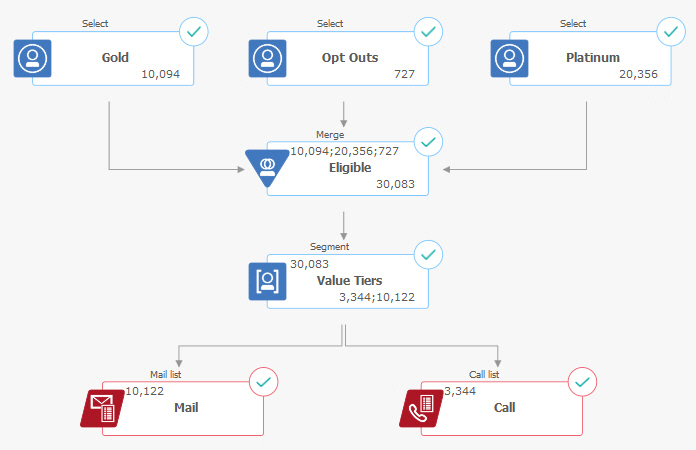
In the first level of the flowchart, Select processes select customers in the Gold and Platinum segments, as well as customers who opted out of marketing communications.
In the second level, a Merge process combines the Gold and Platinum customers and excludes customers who opted out. The result is all Eligible customers.
In the third level, a Segment process divides the eligible customers into value tiers based on their scores.
Finally, each customer is assigned to a list. The high-value customers are output to a call list, so they can be contacted with an offer by phone. The remaining customers are output to a mail list; they will receive a direct mail offer.
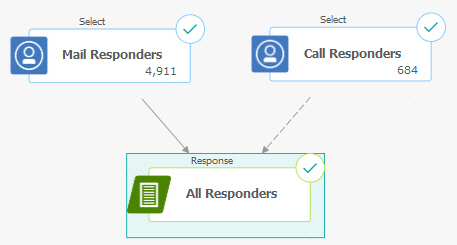
Response flowchart
A second flowchart in this same campaign tracks responses to the offers. The response information is compiled outside of the Unica Campaign application. For example, a call center might record responses in a database or flat file. When the response information is made available to Unica Campaign, your response flowchart can then query the data.
The following example shows a response tracking flowchart. Select process boxes query the Mail Responders and Call Responders. The Response process box evaluates which responses are considered valid and how they are credited back to campaigns or offers. When you run the flowchart, the output of the Response process is written to several response history system tables, where the data can be accessed for analysis using Unica Campaign performance and profitability reports.