Setting chart properties in spreadsheets
You can customize a chart's font, title, legend, background, border, and style of chart type.
Procedure
- Select the chart for which you want to set properties.
- Right-click the chart and select Edit Chart.
The Chart Settings window opens.
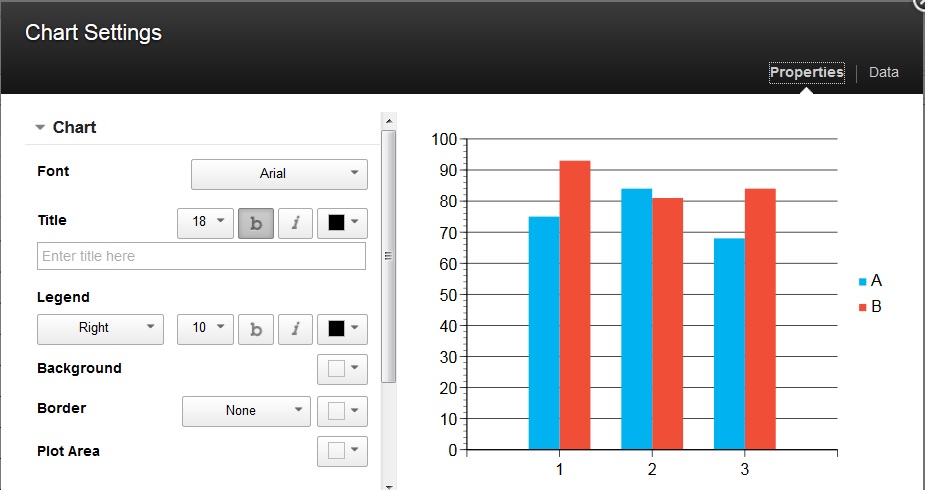 Note: A preview of the chart will be presented. When the chart property is changed, the preview will be updated immediately. The chart in the document will be updated only after clicking OK.
 - Specify the options that you want, and click OK.