Changing data source ranges
Use the Chart Settings window to change a chart's data source ranges without having to redo the chart in the sheet.
Procedure
- Select the chart for which you want to change data source values.
- Right-click the chart and select Edit Chart. The Chart Settings window opens.
- Click Data.
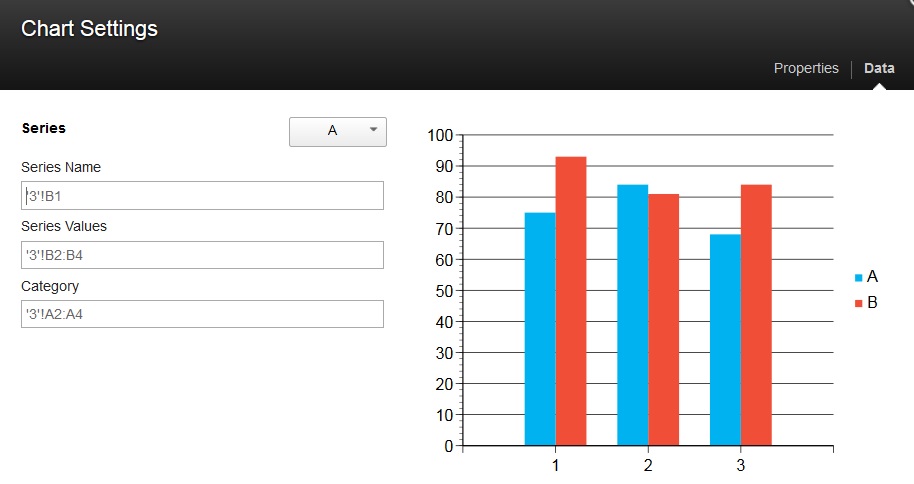
- Choose the series you want to edit by clicking the drop-down menu in the Series.
- Name the series in the Series Name field.
- In the Series Values field, enter
the data range that you want.Note: You can also input one string or one series of data in the Series Values input field.
- Optional: In the Category field, enter the category range.
- Click OK.