Inserting charts in spreadsheets
You can insert a chart into a spreadsheet.
Procedure
- Select the range for which you want to insert a chart.
- Click or click the Insert Chart icon
 on the toolbar.
Tip: You can also right-click the data range and select Insert Chart.
on the toolbar.
Tip: You can also right-click the data range and select Insert Chart. - Select a chart type and then click OK. You can also double-click the chart type that you select.
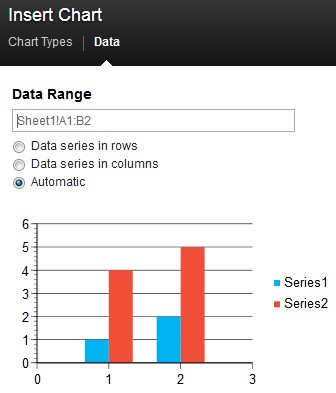
- Optional: To preview how the chart looks with
the data series in rows or in columns, click Data and
then click the option you want.
- If you want to save the chart, you can right-click the
chart and select Download as Image to save
it in .png format.
Note:
- When files in other formats (.xls, .xlsx, and .ods) contain charts, the charts are retained in their supported types when you edit the file in HCL Connections™ Docs. Likewise, when you create charts in HCL Docs and download the file to those formats, the charts are intact.
- You cannot group charts that you insert into a spreadsheet. When you import spreadsheets that already contain grouped charts, you must act on each object separately.