Monitoring Index Load
You can monitor Index Load and use the metrics to tune Index Load for optimal performance.
About this task
- Interactively, by using the Index Load status command while indexing.
- After running Index Load, using the search administration logger.
Procedure
-
Use the metrics that are displayed by the Index Load status command while indexing to help
refine tuning parameters and improve performance throughput:
-
Go to the following URL: http://hostname:portsearch/indexload/status.
The status report is displayed and shows its metrics.For example:
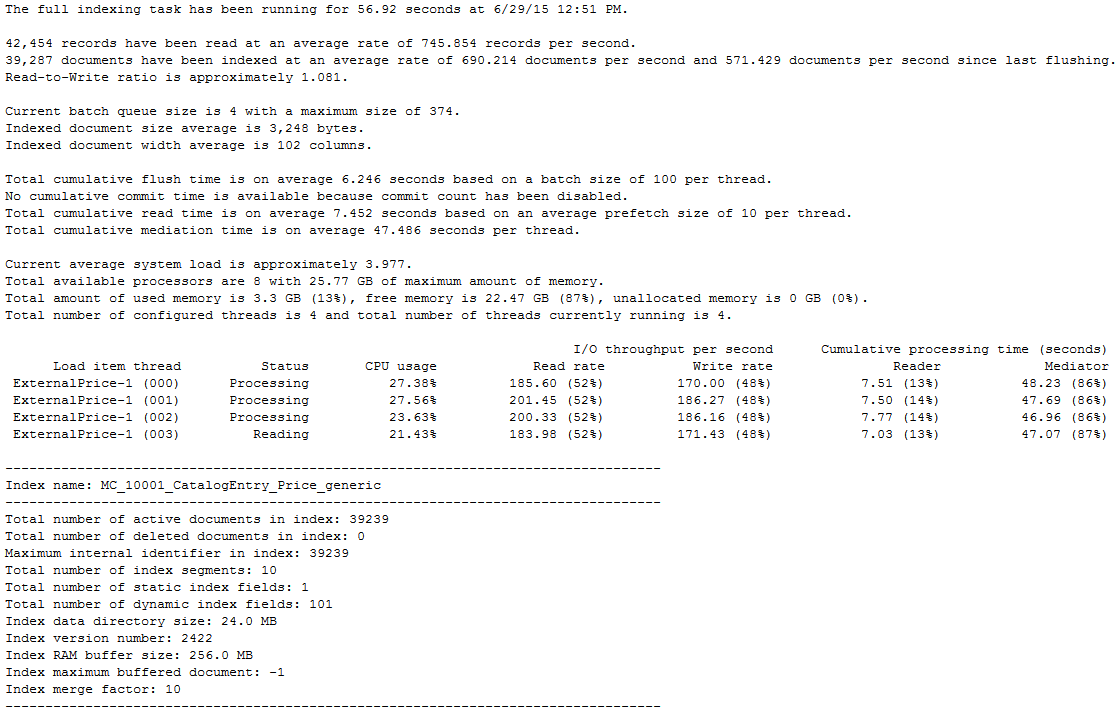
-
Go to the following URL: http://hostname:portsearch/indexload/status.
-
Use the search administration logger to read Index Load statuses from the
admin.log file.
For more information, see Using the WebSphere Commerce Search administration logger.