Creating Charts
Most data views and reports can display the data graphically.
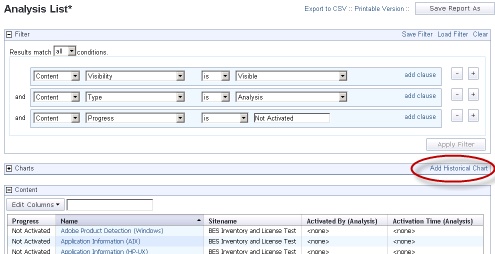
From Explore Data or a Report listing, if a chart is possible, it is shown in a section just below the filter section.
There are two basic chart types: ordinary and historical.
- Click the link to create a new chart. You can attach multiple charts to a report.
- Enter the title for a historical chart and click Create
Chart.
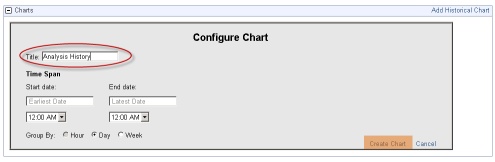
- Your chart is generated immediately.
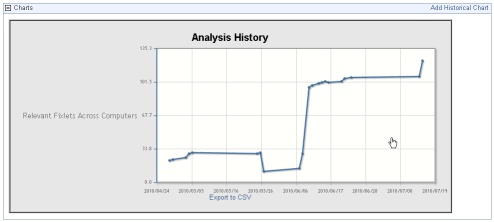
Charts are useful for distilling a huge list of data into a simple graphic, and are extremely useful for busy administrators.