Sample Trace Result
The following sample trace result shows the flow of tainted data through a section of an application that contains an SQL Injection vulnerability.
The code scanned in this sample does not validate or sanitize data that originates from the untrusted source, leaving the door open for attackers to target the application's database.
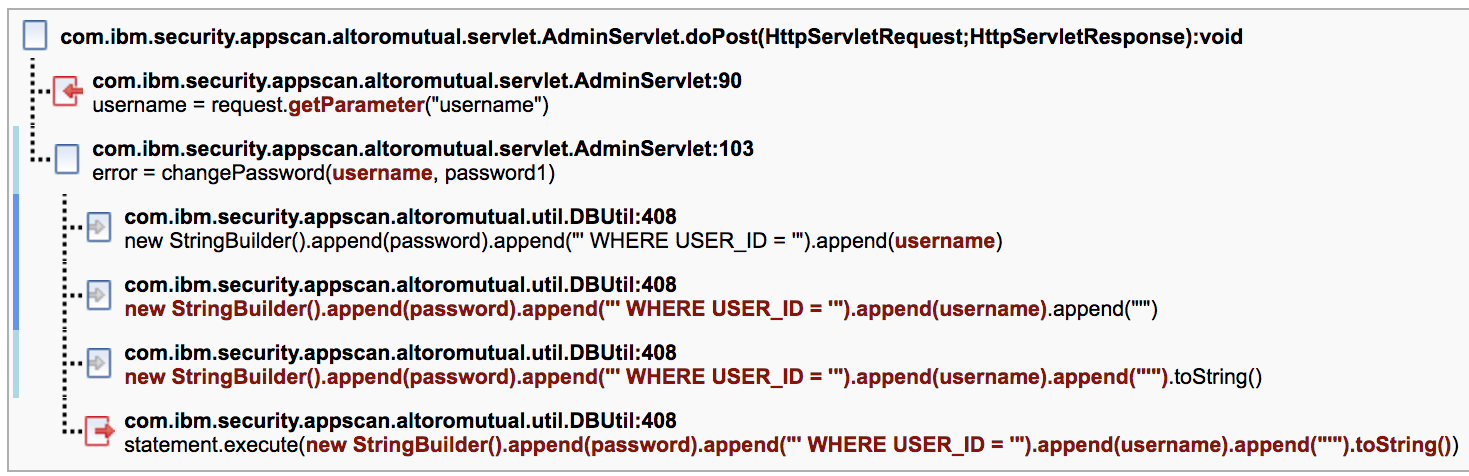
In this sample trace, the doPost servlet method calls
request.getParameter. This method reads the untrusted data (the user name) from the
HTTP POST body, but it does not check the validity of the data, nor does it
sanitize the data. This unverified, or tainted, data is then passed to the
changePassword method. This method eventually passes the tainted data to the
statement.execute method, where the vulnerability can be exploited.
request.getParameter("username")is marked as a source ( ). Its return value is the origin of untrusted
data.
). Its return value is the origin of untrusted
data.statement.execute( )has its first parameter marked as a sink ( ), as tainted data (which contains malicious SQL
commands) could be passed to the
), as tainted data (which contains malicious SQL
commands) could be passed to the sqlparameter without being validated or sanitized.string.Builder( ).append( )is marked as a taint propagator ( ) as it acts as a conduit to pass tainted data
from one point (the first parameter) to another (the return value).
) as it acts as a conduit to pass tainted data
from one point (the first parameter) to another (the return value).- The flow of tainted data is marked in red. The taint begins at
request.getParameterand passes tainted data to theusernamevariable. The data is then passed through the taint propagators until it is appended to an SQL statement and executed by thestatement.executemethod. - Each node in the trace provides the line number in the code at which the trace occurs, along
with the code snippet of interest. For example, the source () occurs at line 90.
- At the left of the trace, blue bars indicate the locations where a fix can be implemented to remove the security vulnerability. In this example, data validation and/or sanitation should be added close to the sink where the tainted data is appended to the SQL statement. A much better solution would be to properly execute this SQL query as a prepared statement.
- In this example, the darker blue bars on the left highlight a method that is common to the trace
of multiple issues. This is called a fix group and it denotes a location in the code that, if
addressed, may resolve more than one issue. As such, fix groups should be investigated first. In
this trace example, the location at which
append ( )is called should be investigated for this particular issue.In the scan report, issues are listed by fix groups if possible. Within each fix group, issue types are listed first, followed by individual issues for each type and the trace for each issue. There are two types of fix recommendations:- If the fix is for a method that is part of the application code, fix the implementation of the code.
- If the fix is for a location that calls third-party code, fix the usage of the code.