Configuring Docker and Podman to run Grafana
Before you begin
- Ensure that the following ports for the different monitoring services are
open.
- Grafana:
3001 - Prometheus:
9091 - Pushgateway:
9092 - Node-exporter:
9100 - Cadvisor:
8088
- Grafana:
- When applicable, ensure that these services are up and active for panels to be
working.
- Pushgateway:
http://host.docker.internal:9092 - Proxy metrics:
http://host.docker.internal:8081/actuator/prometheus - Cadvisor:
http://host.docker.internal:8088/containers
Note: If using a local server, replacehost.docker.internalwithlocalhost. - Pushgateway:
About this task
You must have Grafana administrator privileges to configure the Sametime Grafana dashboard.
Procedure
-
Edit the
docker-compose.ymlfile. Locate thecommunitystatement underenvironmentand add the following environment variable after it.MONITORING_ENABLED=true -
Run the command to start monitoring services.
docker-compose -f docker-compose.yml -f docker-compose-monitoring.yml up -dThe Docker and Podman commands are similar. The only difference is that docker precedes the command when issued in a Docker environment and podman precedes the name in a Podman environment. Example commands used in the Sametime documentation are shown using Docker. For Podman, change docker to podman.
-
When using a remote setup, navigate to the Grafana sign-in page in your
browser.
http://host.docker.internal:3001Note:3001is the default port for Grafana. Alternatively, you can uselocalhost:3001if you are on your local machine. - Enter admin for both username and password, and then select Sign In. If successful, you will be prompted to change the password.
- Select OK and enter the new password.
-
From the side menu, select Settings
 .
.
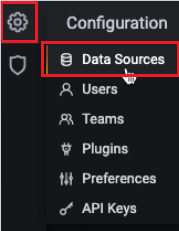
- Select Data sources.
- Select Add data source.
- Select Prometheus as the data source.
-
Open the Prometheus data source and edit the settings. Under the
HTTP section, enter the following URL.
http://host.docker.internal:9091 - Select Save and test. A message is displayed to confirm if the data source is working.
- Upload the Docker_Sametime_Dashboard.json file. For more information, contact HCL Customer Support.
- Select Prometheus (default) as data source and then select Import.
- Save the dashboard.