Monitoring metrics collected by a Prometheus server
You can monitor your system resources by using metrics data that are collected by a Prometheus server while executing a schedule.
Before you begin
You must have created a project in Rational® Test Automation Server.
You must have installed and configured a Prometheus server.
Read the concept information about Resource Monitoring and monitoring Prometheus server source. See Resource Monitoring service
About this task
The following procedure describes how to select and create Prometheus queries in Rational® Test Automation Server. You must set a connection between Rational® Test Automation Server and the Prometheus server first to access to the Prometheus queries.
Enter the connection settings, then select queries.
Procedure
- Click Add a source and select Add a Prometheus Server.
-
In the New server dialog box, enter the connection
settings.
- In Target host, enter the IP address or host name and port number of the host where the Prometheus server is installed.
- Enter the Path to the API root of Prometheus to point to the Prometheus API where the monitoring data are saved.
- Enter the security parameters if required. For information about this section, see related links.
- Click Add to close the dialog box.
The Prometheus server source is created successfully in the background and a dialog box opens to select the Prometheus data queries. -
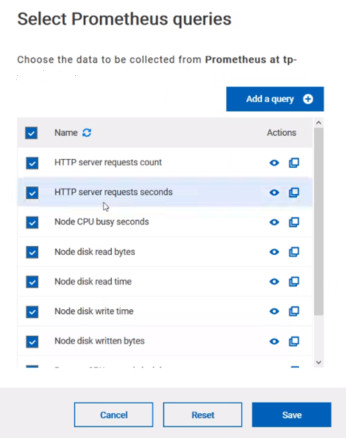
In the Select Prometheus queries dialog box, select
queries that are available in the list to collect Prometheus metrics data by
clicking the checkboxes.
You can reset the selection.
-
Follow these steps to create a query:
-
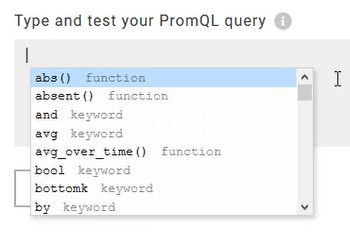
Enter a PromQL query.any keyword and press Ctrl+Space in the
Type and test your PromQL query.
All the possible combinations of keywords and metrics related to your searched keyword are listed.
-
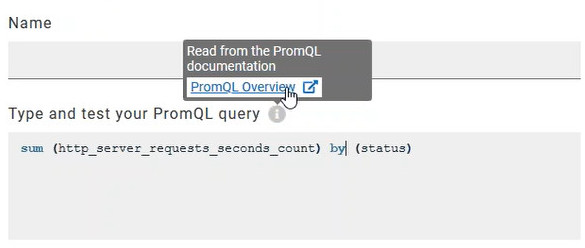
Click the link that points to the 'Querying Prometheus documentation'
page in the information tool tip to find other examples of queries in a
web page that you can use as samples.
-
Enter a PromQL query.any keyword and press Ctrl+Space in the
Type and test your PromQL query.
-
Proceed as follows to duplicate a query:
-
Click the Duplicate icon
 to duplicate a standard query.
Note: You can click Create or Duplicate only if the test of the query is successful and the name of the query is not already in use.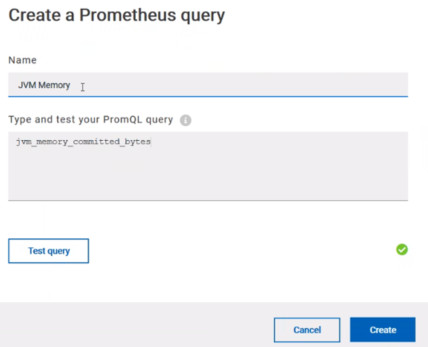
-
Click the Duplicate icon
-
Proceed as follows to modify a query:
-
Click the Modify icon
 .
.
- Modify the name and type of the query.
- Test the query.
- Click Update.
- Delete duplicated or created queries.
- Click Save to close the Select Prometheus queries dialog box.
-
Click the Modify icon
- Click Save and close the Select Prometheus queries dialog box.