Monitoring metrics exposed by an OpenMetrics exporter
With Rational® Test Automation Server, you can monitor your system resources by using metrics data that are exposed by an OpenMetrics or a Prometheus exporter through metric counters while executing a schedule.
Before you begin
You must have at least one exporter or software to expose monitoring metrics with an OpenMetrics or Prometheus format.
You must have created a project in Rational® Test Automation Server.
About this task
The following procedure describes how to select and create OpenMetrics counters in Rational® Test Automation Server. You must set a connection between Rational® Test Automation Server and the OpenMetrics exporter to select counters.
Procedure
- Click Add a source and select Add an OpenMetrics exporter .
-
In the New OpenMetrics exporter dialog box that opens,
enter the OpenMetrics exporter details to access its exposition endpoint as
follows:
- Click the checkboxes to select counters in the Select OpenMetrics counters dialog box.
-
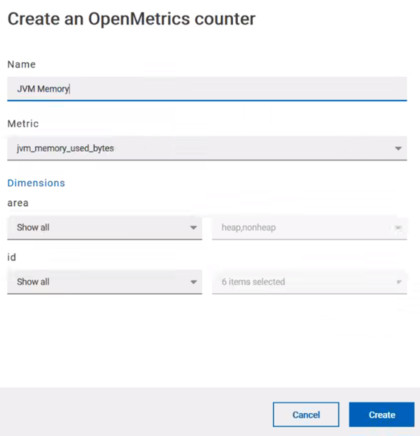
Follow these steps to create a counter:
-
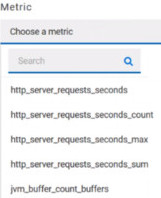
Select metrics in the drop-down list or enter a keyword in the
Dimensions field to enable the dynamic input
help. You can also use the search field that appears in the list of
metrics.
-
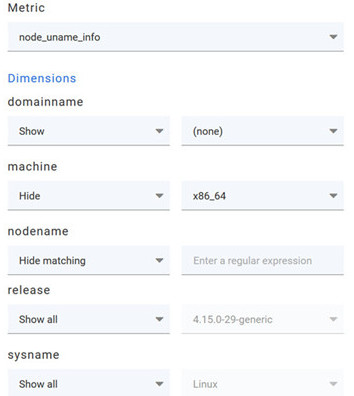
Select Dimensions from the dynamic fields when
they are required.
-
Click Create.
-
Select metrics in the drop-down list or enter a keyword in the
Dimensions field to enable the dynamic input
help. You can also use the search field that appears in the list of
metrics.
-
Follow these steps to duplicate a counter:
-
Select a counter in the list, and click the
Duplicate icon
 .
.
- Modify the name of the counter and the Dimensions.
- Click Create.
-
Select a counter in the list, and click the
Duplicate icon
-
Proceed as follows to modify a new counter:
- Click the Modify icon.
- Modify the name, Metrics, and Dimensions of the counter in the Modify the OpenMetrics counter.
- Click Update.
Note: You can create, duplicate, or update a counter only if the name of the counter is not already used. -
Click Save and close the Select OpenMetrics
counters dialog box.
Note: You can delete counters, but only the ones that you created or duplicated.