Resource Monitoring service
When you apply load to a system under test, the amount of resources consumed by your system is increasing. If the capacity of the resources does not match the load, you can see performance issues in the results. The Resource Monitoring service in Rational® Test Automation Server helps you monitoring the resources of a system and establish the performance metrics of the system. Thus, you can observe the health of these resources while a schedule is running.
You can use the Resource Monitoring service while running a schedule to capture data, such as processor or memory usage, or to monitor the availability of hosts and services by using counters. The Resource Monitoring service can provide a comprehensive view of a system under test to help determine problems. Hosts and services can be servers, virtual machines, or any local host or network services. You can also monitor remote hosts and services with agents.
- Monitoring local host and service
-
You can use the Resource Monitoring service to monitor any local host and network service. In this case, the resources of the hosts are locally monitored. This method is used for host targets that the service can reach directly. With Rational® Test Automation Server, you can also monitor performance metrics that are collected and stored by a monitoring system that is monitoring a host. You can use Prometheus server or a data collector through an exporter, OpenMetrics exporter, for example.
To monitor resources on a local system, you must add the source of the resource monitoring data from the Resource Monitoring page. Then you have to enter some connection settings and select the performance counters to monitor the sources. The metrics are exposed in a graph for each selected counter.
- Monitoring remote host with monitoring agents
You can use the Resource Monitoring service to monitor remote hosts and services with agents through wider sets of data collectors, computers, and networks. The purpose is to capture CPU load, disk space, memory, and the running process for example.Agent-based monitoring is useful when remote services are not directly accessible through the network. Agents are closer to the target that you want to monitor. You can set up the agent on an authorized host, for example, when access to an Apache httpd or NGINX server status page or to a JVM JMX port is restricted to one or few client hosts only. The configuration task is simplified, and no security changes are required.
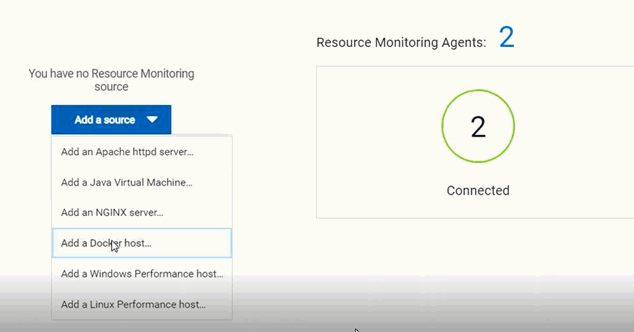
To monitor a host across monitoring agents, you must first set up the Resource Monitoring agents on the target host for which you want to collect the performance statistics. The agents establish a connection with the Resource Monitoring service. When the connection is set, the agent is showing up in the list of sources in the Resource Monitoring main page. You can select it, choose performance counters, and view the metrics statistics in a graph for each selected counter.

- Resource Monitoring sources
- With Rational® Test Automation Server, you can monitor resources for the following
sources:
- Apache httpd server
- NGINX and NGINX Plus
- Java Virtual Machine: You can monitor JVM resources from a local or from a remote system. Some parameters must be set in the command before running the Java Virtual Machine. For more details, see the link to the page about starting a Java Virtual Machine on this page.
- Windows Performance host: To monitor the performance of a
Windows host, you must have installed an agent on the target Windows
host.
If IBM® Rational® Test Automation Server is installed on a Linux system, and you want to check the performance of the Windows host, you must have installed an agent on the target Windows host to start monitoring its performance.
- Linux Performance host: To monitor the performance of a Linux
host, you must have installed an agent on the target Linux
host.
If IBM® Rational® Test Automation Server is installed on a Windows system and you want to check the performance of the Linux host, you must have installed the Resource Monitoring agent on the Linux system.
- Docker host: A Resource Monitoring agent is mandatory to get a Docker Data Collector. The Docker host source is added to the list of resource monitoring sources when the agent is installed.
- Prometheus server: You can monitor metrics of a host under
test that are collected by a Prometheus server. Prometheus collects
metrics from monitored targets by regularly requesting appropriate
HTTP endpoints on these targets (called scraping).
The metrics data are collected through data collectors sets (groups of performance counters) that are tracking the system performance. The performance data results are stored under a Prometheus REST API so that they can be consumed by external systems.
With the Resource Monitoring service in Rational® Test Automation Server, you can query these performance metrics collected by Prometheus servers. 'PromQL' is the language for querying Prometheus metric data.
In the Resource Monitoring service, you can select default queries, or create additional ones.
A Prometheus server is required and it must be configured to scrap a set of exporters, every 15 seconds by default. Pushgateway, service discovery, and Alertmanager are optional.
- OpenMetrics exporter:
You can monitor the metrics of a host under test that are collected and exposed through an OpenMetrics format or a Prometheus exporter format.
The Resource Monitoring service in Rational® Test Automation Server is given the ability to scrap metrics exposed by an OpenMetrics or Prometheus exporter through metric counters. No Prometheus server installation is required, you only need to set up one or multiple OpenMetrics, or Prometheus exporters that fit your software or host target. Refer to the link at the end of this page to see the list of exporters.
Click the links in the next section of this page for more details on the Resource Monitoring tasks you can perform in Rational® Test Automation Server.