Monitoring host resources
To monitor host resources, you must add the monitoring sources to the Resource Monitoring service, enter connection settings and select performance counters that are used to capture the performance statistics.
Before you begin
You must be logged in Rational® Test Automation Server and be the owner of an existing new project.
If you monitor a remote host, it must be connected with the computer that you use to access Resource Monitoring service. See Connecting agents to the Resource Monitoring service.
About this task
This task applies to NGINX and NGINX Plus, Apache httpd server, Java Virtual Machine, Windows Performance host, Linux Performance host, and Docker host sources.
Procedure
- In the Resource Monitoring page, click Add a source, for example: Add an NGINX server.
-
In the New server dialog box, fill
in the following connection settings:
-
In Security, select the following options:
- Secured with TLS/SSL
- If the application server is secured with TLS/SSL.
- Trust self-signed certificate
- To accept the server certificate.
- Do not verify host name
- To ignore verification of the host name in the certificate.
- Require credentials
- If the server requires log-in credentials, enter a User name and Password.
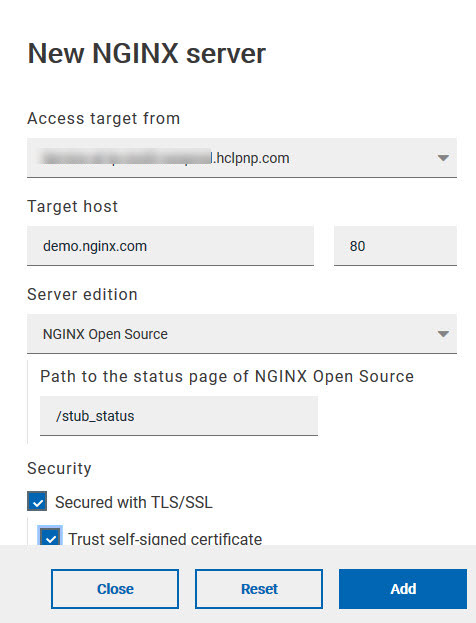 For remote hosts that are already connected to Rational® Test Automation Server through an agent, you have only the Access target from field enabled.
-
In Security, select the following options:
-
Select and save the resource counters to monitor. You can select them from the
list where they follow the server logical organization.
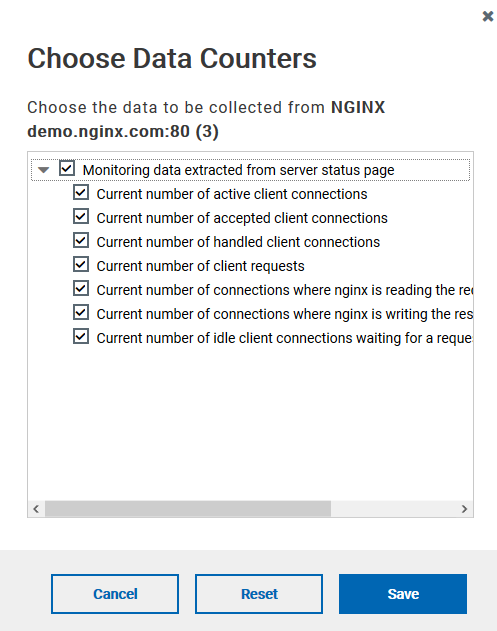 For a faster selection, select the counters from the built-in sets
drop-down list where they are organized by theme and save your selection.
For a faster selection, select the counters from the built-in sets
drop-down list where they are organized by theme and save your selection. 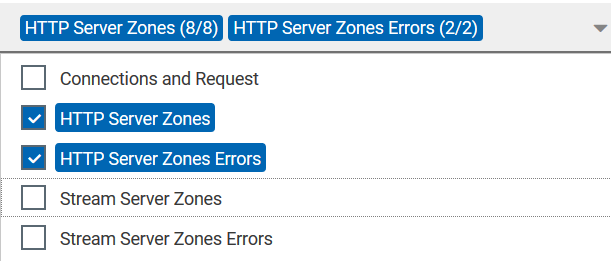 Note:For Docker host, you can select different sets of counters.
- The first level of counters: Generic counters that are related to a Docker Image and all its running Docker Containers (in an exit, running or paused, created, restarted, removing, dead or transitive state).
- The second level of counters: Specific counters that are related to the existing Docker Containers.
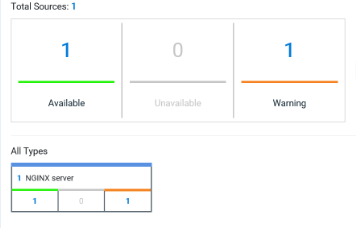
When the selected counters are saved, two tables are displayed in the resource monitoring main page. They contain the total number of sources you have added and the number of sources ordered by type.