Viewing the performance metrics
When you added a monitoring source to the Resource Monitoring service and selected performance counters, the resource monitoring process automatically started. You can view the performance metrics of the system through statistics and a graph for each monitored source and selected counter.
Before you begin
You must have configured a monitoring source. See Monitoring host resources, Monitoring metrics collected by a Prometheus server, and Monitoring metrics exposed by an OpenMetrics exporter.
You access the performance metric results by clicking links in the tables that show the number of monitored sources.
About this task
You can perform the following actions for each resource monitoring source on this page:
Procedure
- Filter the list of sources by collector type or by status.
- Add new monitoring sources.
-
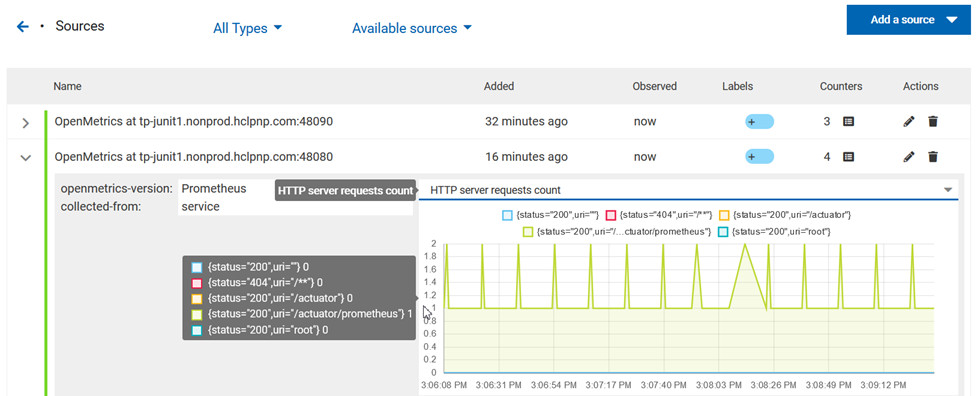
Expand a monitoring source to see the live performance metrics.
A graphic is displayed for each counter.
-
Click
 to change the selection of counters.
The changes are reflected in the resource monitoring graph.
to change the selection of counters.
The changes are reflected in the resource monitoring graph. -
Click the Edit icon
 to change the target host.
-
Click the Delete icon
 to delete the monitoring source.
-
Click the Selection icon
 to select additional counters.
-
Click
 to add a new label. For more information about this action, see the
link in the related information section on this page.
Note: You can add monitoring labels to identify the monitoring sources that can be used when you execute a schedule from Rational® Test Automation Server. Refer to the link in the Related information on this page.
to add a new label. For more information about this action, see the
link in the related information section on this page.
Note: You can add monitoring labels to identify the monitoring sources that can be used when you execute a schedule from Rational® Test Automation Server. Refer to the link in the Related information on this page.