Controlling Resource Monitoring sources in a schedule
In Rational® Test Automation Server, you can control the Resource Monitoring sources that are collected in a performance schedule by adding matching labels.
Before you begin
- Created a performance schedule of Rate or VU type.
- Added Resource Monitoring sources, or the labels of Resource Monitoring sources to a schedule. For more information about the procedure, refer to Adding resource monitoring sources to a performance schedule by using labels.
- Enabled Rational® Test Automation Server as Resource Monitoring service only if you want to replace Resource Monitoring labels set in Rational® Performance Tester with the labels that you create in Rational® Test Automation Server.
You must have created a project and added Resource Monitoring sources to your project in Rational® Test Automation Server. For more information about the procedure, see Monitoring host resources.
About this task
- To replace the Resource Monitoring labels that were initially set in a schedule from Rational® Performance Tester with the labels that you create in Rational® Test Automation Server.
- To enable Resource Monitoring sources that were not enabled from Rational® Performance Tester. In that case, Resource Monitoring sources are enabled by setting labels in the Execution dialog box from Rational® Test Automation Server.
- To ignore Resource Monitoring sources that were set in the schedule and to change for a label matching mode.
Procedure
-
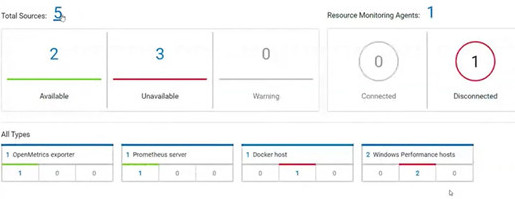
Click a source that is available in your project, either in the
Total Sources cards, or in the All
Types cards from the Resource Monitoring page.
-
Click
 under the Labels column of a Resource Monitoring
source to add a label.
under the Labels column of a Resource Monitoring
source to add a label.
-
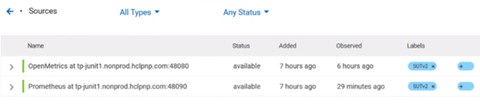
Enter a name for the label and press the Enter key.
Example: Enter 'SUTv2' in three different Resource Monitoring sources.
Note: You can add one label or multiple labels for the same Resource Monitoring source. A label can contain a maximum of 200 characters.Tip: You can create the same label for different sources that belong to the same logical group to monitor the whole group with only one label. -
Navigate to the Execute view and click
 on a performance schedule in the list of tests to execute a schedule.
-
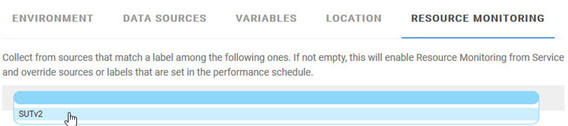
Click the Resource Monitoring tab in the Execute
Test Asset dialog box and click the .
-
Either press the Ctrl + Space keys, or enter the initial letter of a label to
select a label in the list.
Example: Select 'SUTv2'.
 You can see all the labels that you added to the Resource Monitoring sources.Note: Adding at least one label in the Execution dialog box, produce the following actions:
- Enables Resource Monitoring in the schedule if it was not already enabled.
- Enables label matching if explicit sources were previously set. The labels created from Rational® Test Automation Server are used to match with the sources and any other Resource Monitoring labels previously set in the schedule are ignored.
- Click Execute to execute the performance schedule.
- Click the Result view in the navigation bar of Rational® Test Automation Server when the schedule is complete.
-
Expand the performance schedule result to see the Resource Monitoring label
name in the Details card.
The Details card displays the Resource Monitoring labels that are used in the schedule to override the initial labels and collect Resource Monitoring sources. In the example, the 'SUTv2' label. For other details about the Results page, see the link at the end of this page.
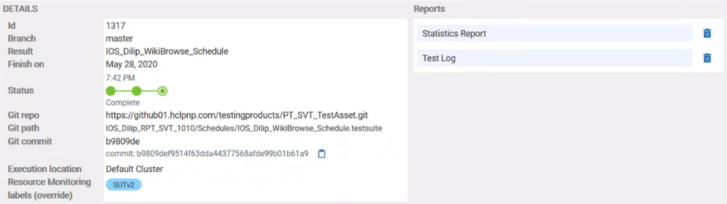
In the Report card, you find the link to the Statistics Report that is generated. In the Resource tab of the Statistics Report, you can view the information related to the Server sources matching the labels set in the schedule.
-
Click the Statistics Report link in the
Reports card to see the performance metrics of the
Monitoring sources matching the selected labels.
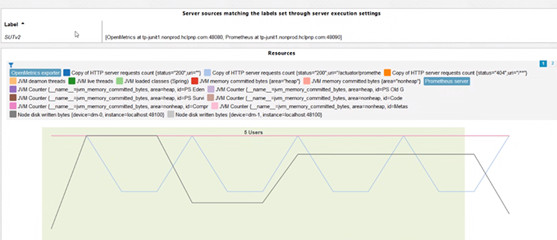 Example: You can see the statistics for the sources tagged with the same 'SUTv2' label.