Monitor Configuration view
After you set up the system under test for recording, you can choose what you want to record in the Recording Studio. You can do this by selecting Monitor Configuration (in the upper-left portion of the Recording Studio perspective) that specifies what you want to record. It shares space with the Triggers view. To show the Monitor Configuration view, click the Monitor Configuration tab at the bottom of the view.
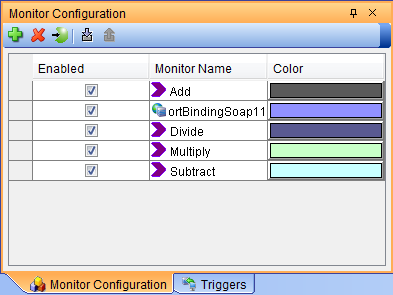
The view shows operations in a grid. The monitoring status (enabled or disabled) is displayed for each operation, in the background color that is used in the Events view to distinguish between events that are captured for the corresponding operation. You can change the highlight color in the operation, if required (see Changing the Recording Studio color for an operation). Monitor Configuration settings can be exported, and later imported, which can be useful with complex monitoring configurations. You can export the Monitor Configuration settings and import them later, as needed; this can be useful with complex monitoring configurations.
You can use a single event monitor to record interactions with a particular operation or everything that happens over a particular transport. Some transports might have a lot of information, and so you can choose to ignore some events. Use the Monitor Configuration view to filter the events you have recorded. You can highlight one or more operations in the Monitor Configuration view to display only the events recorded from the corresponding operation. A label in the Events view shows the number of events displayed compared to the total number of events recorded. If none of the operations is highlighted, the effect is the same as if all the operations are highlighted, that is, all events are displayed.