DevOps Research and Assessment (DORA) metrics
You can use DORA metrics to evaluate the performance of the team.
- Lead Time for Changes
- Deployment Frequency
- Time To Restore Service (MTTR)
Lead Time for Changes
The lead time for changes is the quantity of time it takes a dot to progress from commit to production deployment. The metrics calculation is based on the date of the commit and date of the deployment into production. The lead time for changes metrics is a default metric added to all available value streams metrics bar.
- On the Insights page, in the All dashboards tab, click any dashboard.
- On the selected dashboard page, click Add charts.
- In the Add charts section, click the right angled arrow for DORA to see the list of metrics.
- Click Add+ for Lead Time for Changes to add the metric.
- The chart area displays the data for Lead Time for Changes.
Deployment Frequency
Deployment Frequency Counts assess the number of deployments into production over a time. The metrics calculation is based on the deployment start date and end date.
- On the Value streams page, in the All Value streams tab, click any value stream.
- On the value stream tab, click + to add the required metrics.
- In the Add metrics window, perform any one of the following steps to complete
the addition of the production deployment count metrics:
- Click + to add a production deployment count metric with
the default values for parameter fields. See the following table for parameters,
descriptions, and default values.
Parameter Description Default value Metric title The title of the metric to display in value steams metrics bar. Production deployment counts Relative time The time to use for the metric calculation 30 days or a custom value Stages The staging environment of the pipeline Velocity takes the last viewed staging environment - Click the down arrow to enter the details for the metric. See the following table
for parameters and descriptions:
Parameter Description Metric title The title of the metric to display in value steams metrics bar. Relative time The time to use for the metric calculation Stages The staging environment of the pipeline
- Click + to add a production deployment count metric with
the default values for parameter fields. See the following table for parameters,
descriptions, and default values.
- On the Insights page, in the All dashboards tab, click any dashboard.
- On the selected dashboard page, click Add charts.
- In the Add charts section, click the right angled arrow for DORA to see the list of metrics.
- Click Add+ for Deployment Frequency to add the metric.
- The chart area displays the data for Deployment Frequency metric.
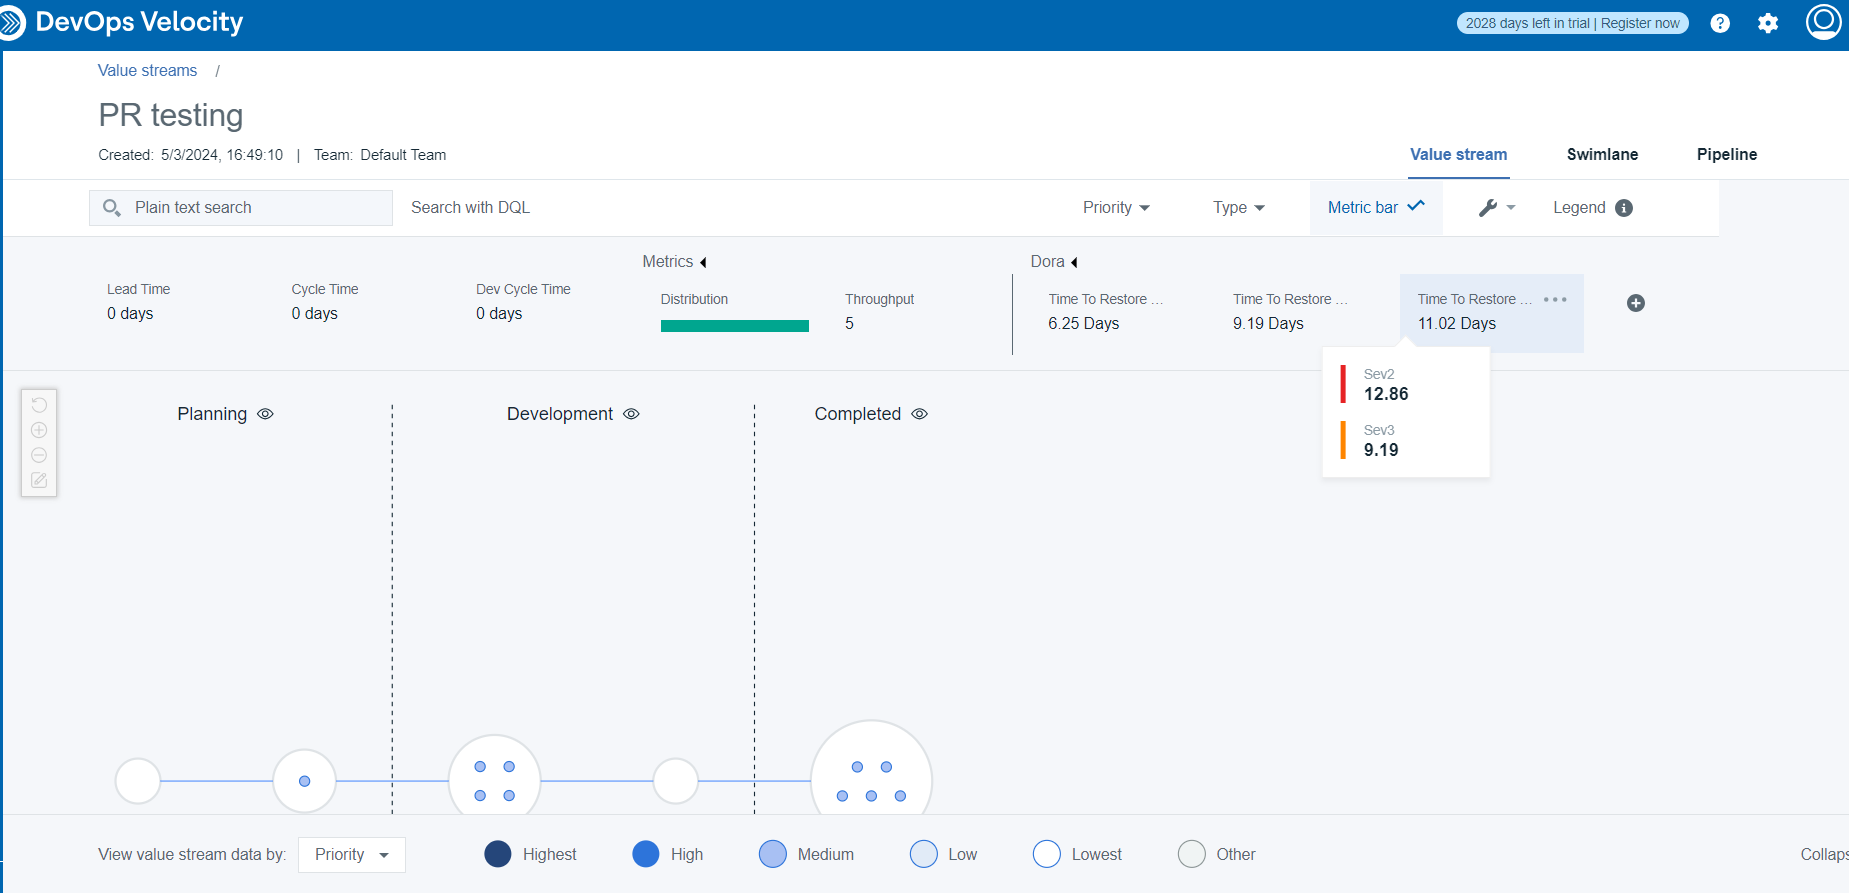
Time To Restore Service (MTTR)
Time to restore service is a metric to calculate the time that team members spend to resolve the reported incident. This metric calculation is based on the incident creation date and incident resolution date.
To view the severity levels You must integrate the Jira Srrvice Management plug-in to view the severity levels.
- On the Value streams page, in the All Value Streams tab, click any value stream.
- On the Value Stream tab, click + to add the required metrics.
- In the Add Metrics window, perform any one of the following steps to complete
the addition of the Time To Restore Service:
- Click + to add a production deployment count metric with
the default values for parameter fields. See the following table for parameters,
descriptions, and default values.
Parameter Description Default value Metric title The title of the metric to display in value steams metrics bar. Time to Restore Service Relative time The time to use for the metric calculation 30 days or a custom value Aggregation interval The interval for data aggregation Days Severity The incident severity levels are a measure of the impact an incident has on the business.
SEV1, SEV2, SEV3, SEV4, and SEV5 - Click the down arrow to enter the details for the metric. See the following table
for parameters and descriptions:
Parameter Description Metric title The title of the metric to display in value steams metrics bar. Relative time The time to use for the metric calculation Aggregation interval The interval for data aggregation Severity The incident severity levels are a measure of the impact an incident has on the business.
- Click + to add a production deployment count metric with
the default values for parameter fields. See the following table for parameters,
descriptions, and default values.
- On the Insights page, in the All dashboards tab, click any dashboard.
- On the selected dashboard page, click Add charts.
- In the Add charts section, click the right angled arrow for to see the list of metrics.
- Click Add+ for Time To Restore Service to add the
metric.
The chart area displays the data for Time To Restore Service metric.
- Click Time To Restore Service metric to view the severity
levels.