Graphical Report View
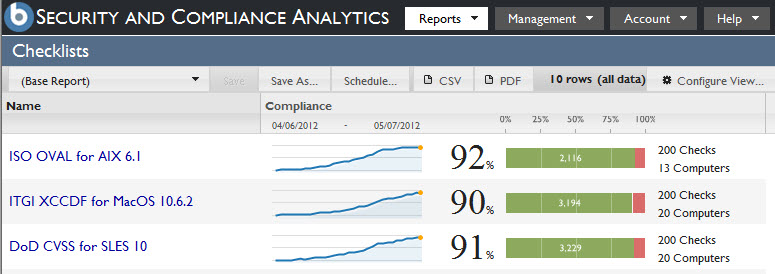
You can view a variety of graphical charts that display different aspects of the security data in your deployment. You can select the columns to be displayed, change column arrangement, and filter data.
You can view a variety of graphical charts that display different aspects of the security data in your deployment. You can select the columns to be displayed, change column arrangement, and filter data.