Running a sample query
System queries are sample queries that are marked with the BigFix icon. As Content Creators, you can load, hide, delete, and reload sample queries in operator sites.
BigFix provides sample queries under the categories Applications, Files, Devices, Networks, Processes, Registry, Policies, and Users.
Note: If multiple content creators save a copy of query with the same name and category in different
sites, the application creates multiple instances of the query.
To run a sample query, do the following steps:
- Click on a category tab.
- From the listed queries, select a query to display it in the editor. You can also use search and filter functions to locate a specific query.
- If the query has parameters, enter the parameter values or accept the default values, if provided. You must use the Operator View to specify parameter values at run time. For more information, see Managing parameters in queries.
- In the Device Targeted section, click Devices
Targeted to open the target list. To select the list of targets to display,
click either Target By Device or Target By
Group.
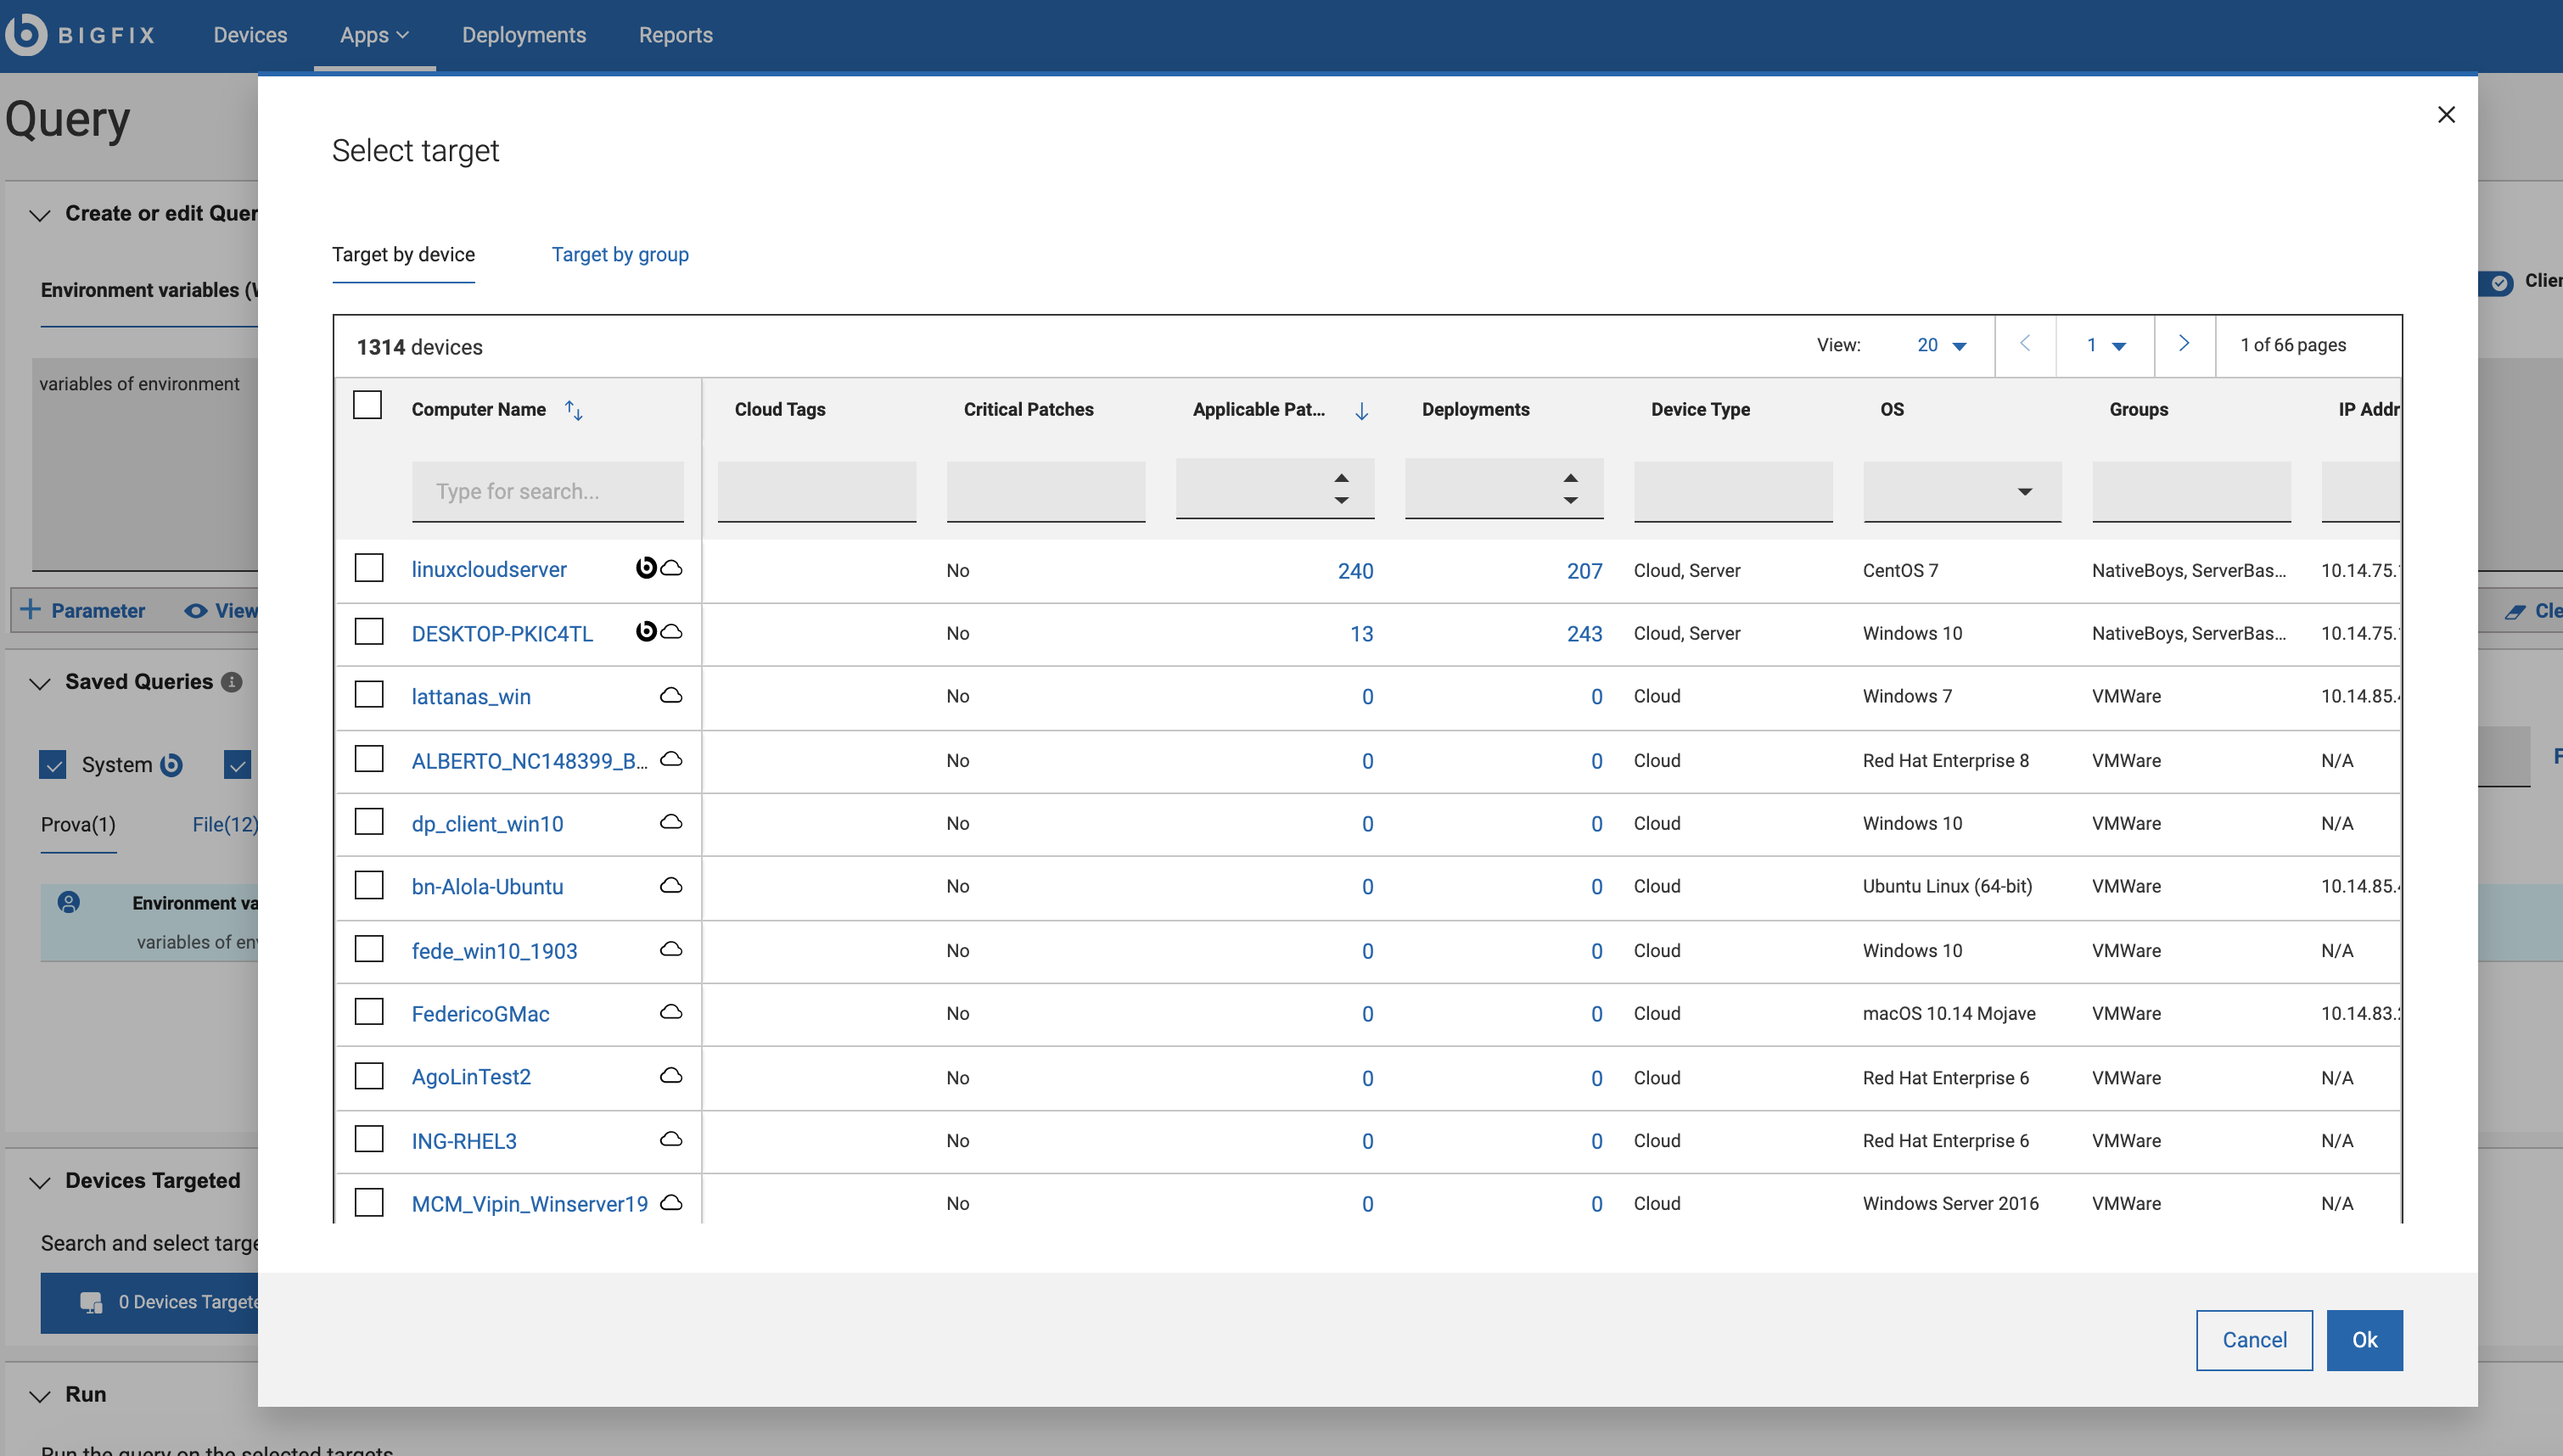
- Select one or more target devices in which you want to run the query.
- You can select individual devices or groups. The targets are listed as per the
permissions of the user. Master Operators see all devices and groups. Non-Master
Operators might see a subset of the complete list. Use the sort, search, and filtering functions to quickly
locate target devices.
- To find a specific device or group, enter its name in the Search field for the name column.
- Use filters to locate devices with specific properties.
When the device or group selection is complete click OK to return to the editor. The Devices Targeted button displays the total number of devices selected.
Note: When pairing queries and targets, keep in mind that queries that are concise and limited in scope run most efficiently. Broad queries return larger data sets and use more resources and affect the query performance. - You can select individual devices or groups. The targets are listed as per the
permissions of the user. Master Operators see all devices and groups. Non-Master
Operators might see a subset of the complete list. Use the sort, search, and filtering functions to quickly
locate target devices.
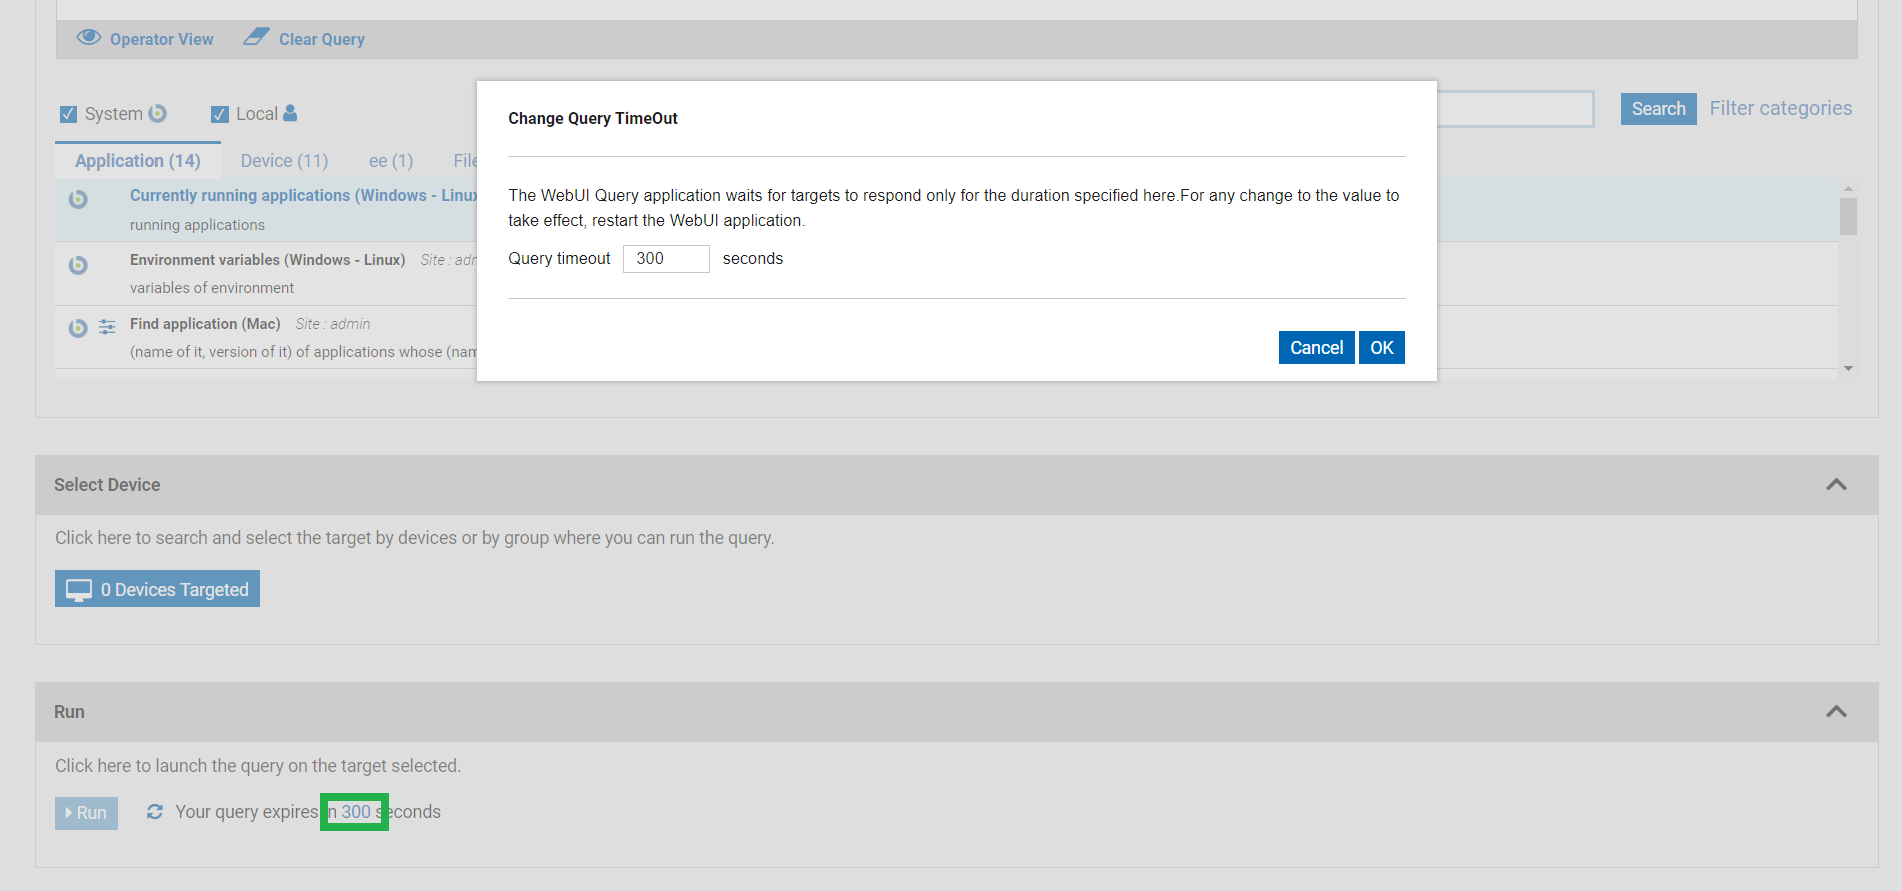
- To limit the polling time taken by the server to fetch the results, you can
set Query timeout. The default time is 300 sec and the maximum limit is 900 sec. To change
the default time, click the link on the default time, and in the Change Query
TimeOut popup, enter the required number of seconds. For broader queries,
server stops polling the results when it reaches the specified polling time.
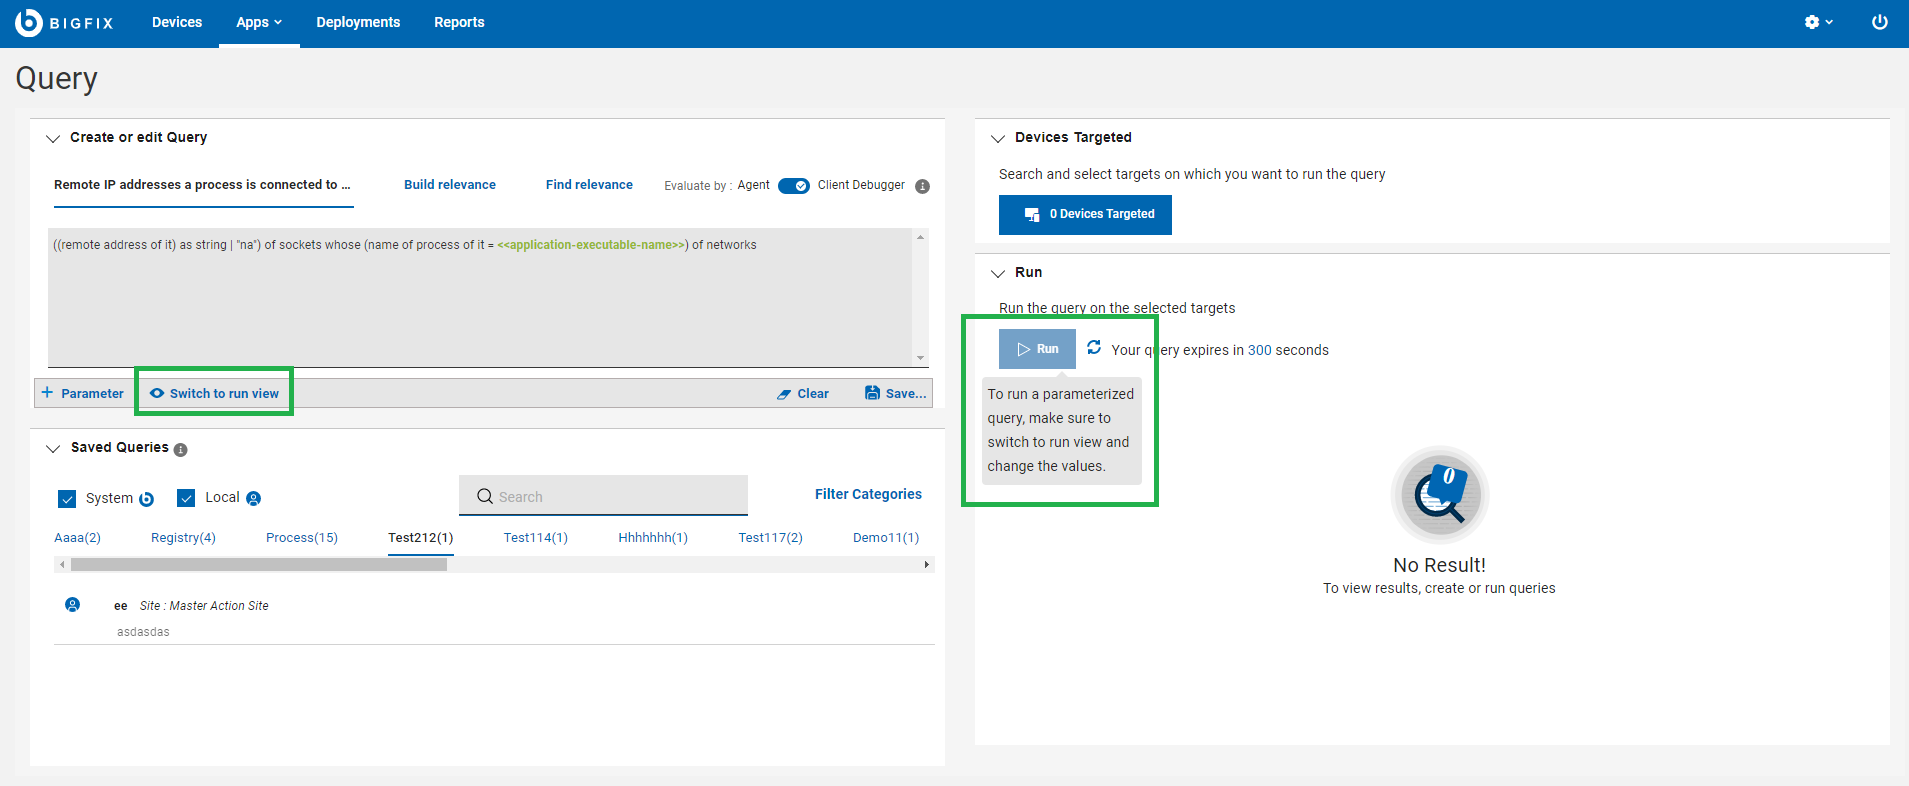
- To run the query, click Run. If you want to cancel the query, you
can do it while the results are loading.Note: To run a parameterized query make sure to switch to run view and change the values.
- Review your results. Devices report in real time, and new arrivals are appended to the
list as clients report in within the set time limit.
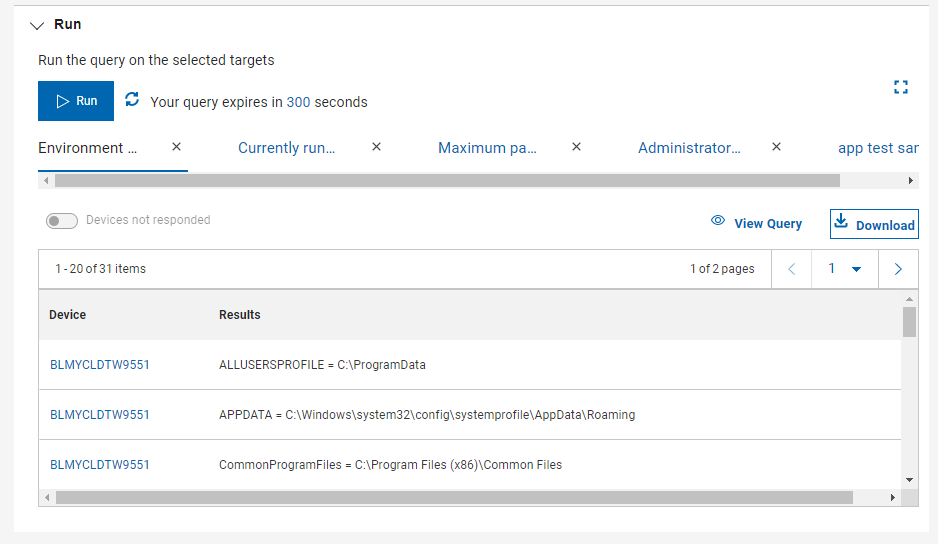
- To switch to full screen mode and see more results, click the Expand icon. Click the icon again, or press the Escape key, to exit from full screen mode.
- Left corner of the list show the total number of rows, and the number of devices that reported so far.
- You can view the total number of resultant pages and navigate between pages by selecting the page number or using < previous and > next navigation buttons.
- You can view the report of five recent query runs. To see the query details click on
 icon.
icon. - Select the report and click Download button to download the report as a .csv file.
- Click the clock icon to see the titles of the recent 10 query runs.
- To save the results to a file in comma-separated values (.csv) format, click the Download button.